
Concept explainers
Videos
Population of Children The following table gives the estimated population (in millions) of U.S. boys age 5 and under and U.S. girls age 5 and under in selected years.
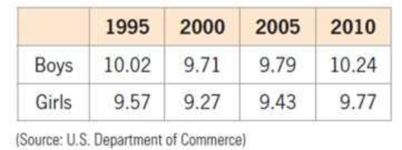
A function that models the population (in millions) of U.S. boys age 5 and under t years after 1990 is B(t) = 0.0076t2 – 0.1752t + 10.705, and a function that models the population (in millions) of U.S. girls age 5 and under t years after 1990 is G(t) = 0.0064t2 – 0.1448t + 10.12.
a. Find the equation of a function that models the estimated U.S. population (in millions) of children age 5 and under t years after 1990.
b. Use the result of part (a) to estimate the U.S. population of children age 5 and under in 2003.
Want to see the full answer?
Check out a sample textbook solution
Chapter 4 Solutions
College Algebra in Context plus MyLab Math with Pearson eText and Note-taking Guide -- Access Card Package (5th Edition)


- Population Growth The projected population of the United States for the years 2025 through 2055 can be modeled by P=307.58e0.0052t, where P is the population (in millions) and t is the time (in years), with t=25 corresponding to 2025. (a) Use a graphing utility to graph the function for the years 2025 through 2055. (b) Use the table feature of the graphing utility to create a table of values for the same time period as in part (a). (c) According to the model, during what year will the population of the United States exceed 430 million?arrow_forwardLater High School Graduates This is a continuation of Exercise 16. The following table shows the number, in millions, graduating from high school in the United States in the given year. Year Number graduating in millions 2001 2.85 2003 2.98 2005 3.11 2007 3.24 a. Find the slope of the linear function modeling high school graduations, and explain in practical terms the meaning of the slope. b. Find a formula for a linear function that models these data. c. Express, using functional notation, the number graduating from high school in 2008, and then calculate the value. d. The actual number graduating from high school in 1994 was about 2.52 million. Compare this with the value given by the formula in part b and with your answer to part of Exercise 16. Which is closer to the actual value? In general terms, what was the trend in high school graduations from 1985 to 2007? 16. High School Graduates The following table shows the number, in millions, graduating from high school in the United States in the given year.16 Year Number graduating in millions 1985 2.83 1987 2.65 1989 2.47 1991 2.29 a. By calculating difference, show that these data can be modeled using a linear function. b. What is the slope for the linear function modeling high school graduations? Explain in practical terms the meaning of the slope. c. Find a formula for a linear function that models these data. d. Express, using functional notation, the number graduating from high school in 1994, and then use your formula from part c to calculate that value.arrow_forward

 Algebra & Trigonometry with Analytic GeometryAlgebraISBN:9781133382119Author:SwokowskiPublisher:Cengage
 Trigonometry (MindTap Course List)TrigonometryISBN:9781337278461Author:Ron LarsonPublisher:Cengage Learning
 Functions and Change: A Modeling Approach to Coll...AlgebraISBN:9781337111348Author:Bruce Crauder, Benny Evans, Alan NoellPublisher:Cengage Learning