
Videos
Average Monthly Temperature The average monthly temperature (in °F) in Seattle. Washington, is shown in the table.
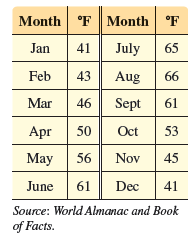
(a) Plot the average monthly temperature over a two-year period, letting x = 1 correspond to January of the first year. Do the data seem to indicate a translated sine graph?
(b) The highest average monthly temperature is 66°F in August, and the lowest average monthly temperature is 41°F in January. Their average is 53.5°F. Graph the data together with the line y = 53.5. What docs this line represent with regard to temperature in Seattle?
(c) Approximate the amplitude, period, and phase shift of the translated sine wave.
(d) Determine a
(e) Graph f together with the data on the same coordinate axes. How well docs f model the given data?
(f) Use the sine regression capability of a graphing calculator to find the equation of a sine curve that fits these data.
Want to see the full answer?
Check out a sample textbook solution
Chapter 4 Solutions
MyLab Math with Pearson eText -- 24-Month Standalone Access Card -- for Trigonometry


 Algebra & Trigonometry with Analytic GeometryAlgebraISBN:9781133382119Author:SwokowskiPublisher:Cengage