
Concept explainers
Videos
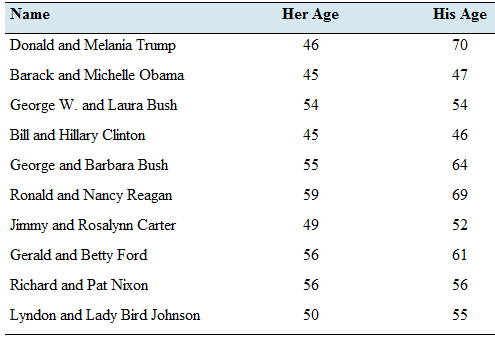
Presidents and first ladies: The presents the ages of the last 10 U.S. presidents and their wives on the first day of their presidencies.
- Compute the least-squares regression line for predicting the president’s age from the first lady’s age.
- Compute the coefficient of determination-
- Construct a
scatterplot of the presidents' ages (y) versus the first ladies' ages (x). - Which point is an outlier?
- Remove die outlier and compute the least-squares regression line for predicting the president’s age from the first lady: s age.
- Is the outlier influential? Explain.
- Compute the coefficient of determination for the data set with the outlier removed. Is due proportion of variation explained by due least-squares regression he greater, less. or about the same without due outlier? Explain.
a.
To Calculate: The least-squares regression line for predicting the president’s age from lady’s age.
Answer to Problem 24E
The least-squares regression line is,
Explanation of Solution
Given: The following table presents the age of the president’s and their wives on the first day of their presidencies.
| Name | Her Age | His Age |
| Donald and Melania Trump | 46 | 70 |
| Barak and Mechelle Obama | 45 | 47 |
| George W. and Laura Bush | 54 | 54 |
| Bill and Hillary Clinton | 45 | 46 |
| George and Babara Bush | 55 | 64 |
| Ronald and Nancy Reagan | 59 | 69 |
| Jimmy and Rosalyn Carter | 49 | 52 |
| Gerald and Betty Ford | 56 | 61 |
| Richard and Pat Nixon | 56 | 56 |
| Lyndon and Lady Bird Johnson | 50 | 55 |
Calculation:
Here,
From below formula we can find least regression line.
where
We can find these constants from below formulas.
Where,
| Descriptive Statistics | |||
| N | Mean | Std. Deviation | |
| His age | 10 | 57.40 | 8.409 |
| Her age | 10 | 51.50 | 5.148 |
| Valid N (listwise) | 10 | ||
To find constants,
And,
By substituting above formula,
Conclusion:
The least-squares regression line for predicting the president’s age from lady’s age is,
b.
To find: The correlation coefficient of the two variables.
Answer to Problem 24E
The correlation coefficient is found to be,
Explanation of Solution
Calculation:
The correlation coefficient
Where
The means and the standard deviations of the both variables can be obtained by using the Excel.
| Descriptive Statistics | |||
| N | Mean | Std. Deviation | |
| His age | 10 | 57.40 | 8.409 |
| Her age | 10 | 51.50 | 5.148 |
| Valid N (listwise) | 10 | ||
Then,
Then, a table should be constructed to calculate
The correlation coefficient can be calculated as,
Conclusion:
The correlation coefficient between the interest rates for two mortgage plans is found tobe,
c.
To graph: The scatter plot of the given two quantitative variables.
Explanation of Solution
Graph:
Let
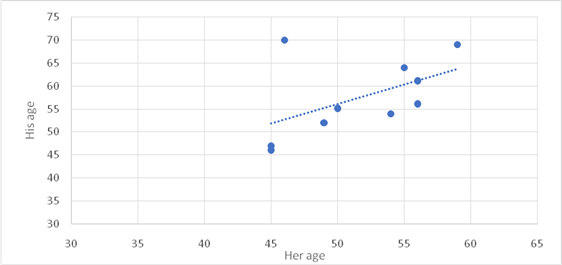
Interpretation:
Out of all these
d.
To Identify: The outliers within the given data.
Answer to Problem 24E
There is one outlier which is age
Explanation of Solution
Explain:
Here, Excel is used to calculate below statistics.
The interquartile range is equal to
To calculate upper bound,
To calculate lower bound,
An outlier is a data point that lies outside the upper bound and lower bound.
Out of all
e.
To find: The least-squares regression line for predicting the president’s age from lady’s age with removing outlier.
Answer to Problem 24E
The least-squares regression is,
Explanation of Solution
Calculation:
Here,
From below formula we can find least regression line.
where
We can find constants from below formulas.
Where,
When the outlier is removed, the number of ordered pairs is
| Descriptive Statistics | |||
| N | Mean | Std. Deviation | |
| His age | 9 | 56.00 | 7.583 |
| Her age | 9 | 52.11 | 5.061 |
| Valid N (listwise) | 9 | ||
To find constants,
And,
By substituting into the above formula,
Conclusion:
The least-squares regression line for predicting the president’s age from lady’s age is,
f.
To Check: The influence of outlier.
Answer to Problem 24E
Yes. It is influenced.
Explanation of Solution
Explain:
| Descriptive Statistics | |||
| N | Mean | Std. Deviation | |
| His age | 10 | 57.40 | 8.409 |
| Her age | 10 | 51.50 | 5.148 |
| Valid N (listwise) | 10 | ||
| Descriptive Statistics | |||
| N | Mean | Std. Deviation | |
| His age | 9 | 56.00 | 7.583 |
| Her age | 9 | 52.11 | 5.061 |
| Valid N (listwise) | 9 | ||
To calculate above statistics, Excel is used. Here we can see statistics with outlier and without outlier. Second table shows statistics without outlier. Total number of observations, mean and standard deviation of dependent and independent variables are changed. So, it influences to least squares regression line for predicting the president’s age from lady’s age.
g.
To find: The correlation coefficient of the two variables without outlier.
Answer to Problem 24E
The correlation coefficient is found to be,
Explanation of Solution
Calculation:
The correlation coefficient
Where
The means and the standard deviations of the both variables can be obtained by using the Excel.
For the remaining
| Descriptive Statistics | |||
| N | Mean | Std. Deviation | |
| His age | 9 | 56.00 | 7.583 |
| Her age | 9 | 52.11 | 5.061 |
| Valid N (listwise) | 9 | ||
Then,
Then, a table should be constructed to calculate
The correlation coefficient can be calculated as,
Conclusion:
The correlation coefficient between the interest rates for two mortgage plans is found to be,
Want to see more full solutions like this?
Chapter 4 Solutions
Elementary Statistics ( 3rd International Edition ) Isbn:9781260092561


 Linear Algebra: A Modern IntroductionAlgebraISBN:9781285463247Author:David PoolePublisher:Cengage Learning
 Glencoe Algebra 1, Student Edition, 9780079039897...AlgebraISBN:9780079039897Author:CarterPublisher:McGraw Hill
 Big Ideas Math A Bridge To Success Algebra 1: Stu...AlgebraISBN:9781680331141Author:HOUGHTON MIFFLIN HARCOURTPublisher:Houghton Mifflin Harcourt