Concept explainers
Videos
Comparing Data Sets. For each of Exercises 25–28, do the following:
a. Find the
b. Give the five-number summary and draw a boxplot for each of the data sets.
c. Find the standard deviation for each of the data sets.
d. Apply the range rule of thumb to estimate the standard deviation of each of the data sets. How well does the rule work in each case? Briefly discuss why it does or does not work well.
e. Based on all your results, compare and discuss the two data sets in terms of their center and variation.
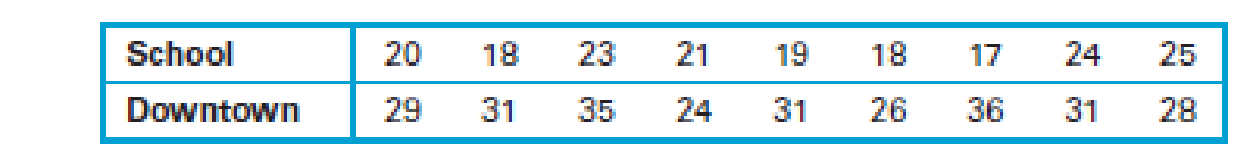
26. The following data sets give the driving speeds (in mi/h) of the first nine cars to pass through a school zone and the first nine cars to pass through a downtown intersection.
Want to see the full answer?
Check out a sample textbook solution
Chapter 4 Solutions
Student's Solutions Manual For Statistical Reasoning For Everyday Life Format: Paperback


 Glencoe Algebra 1, Student Edition, 9780079039897...AlgebraISBN:9780079039897Author:CarterPublisher:McGraw Hill
 Big Ideas Math A Bridge To Success Algebra 1: Stu...AlgebraISBN:9781680331141Author:HOUGHTON MIFFLIN HARCOURTPublisher:Houghton Mifflin Harcourt