
Concept explainers
Videos
DRAW IT (a) Estimate the average CO2 concentration in 1975 and in 2012 using the data provided in Figure 43.25. (b) On average, how rapidly did CO2 concentrations increase (ppm/yr) from 1975 to 2012? (c) Estimate the approximate CO2 concentration in 2100, assuming that the CO2 concentration continues to rise as fast as it did from 1975 to 2012. (d) Draw a graph of average CO2 concentration from 1975 to 2012 and then use a dashed line to extend the graph to the year 2100. (e) Identify the ecological factors and human decisions that might influence the actual rise in CO2 concentration. (f) Discuss how additional scientific data could help societies predict this value.
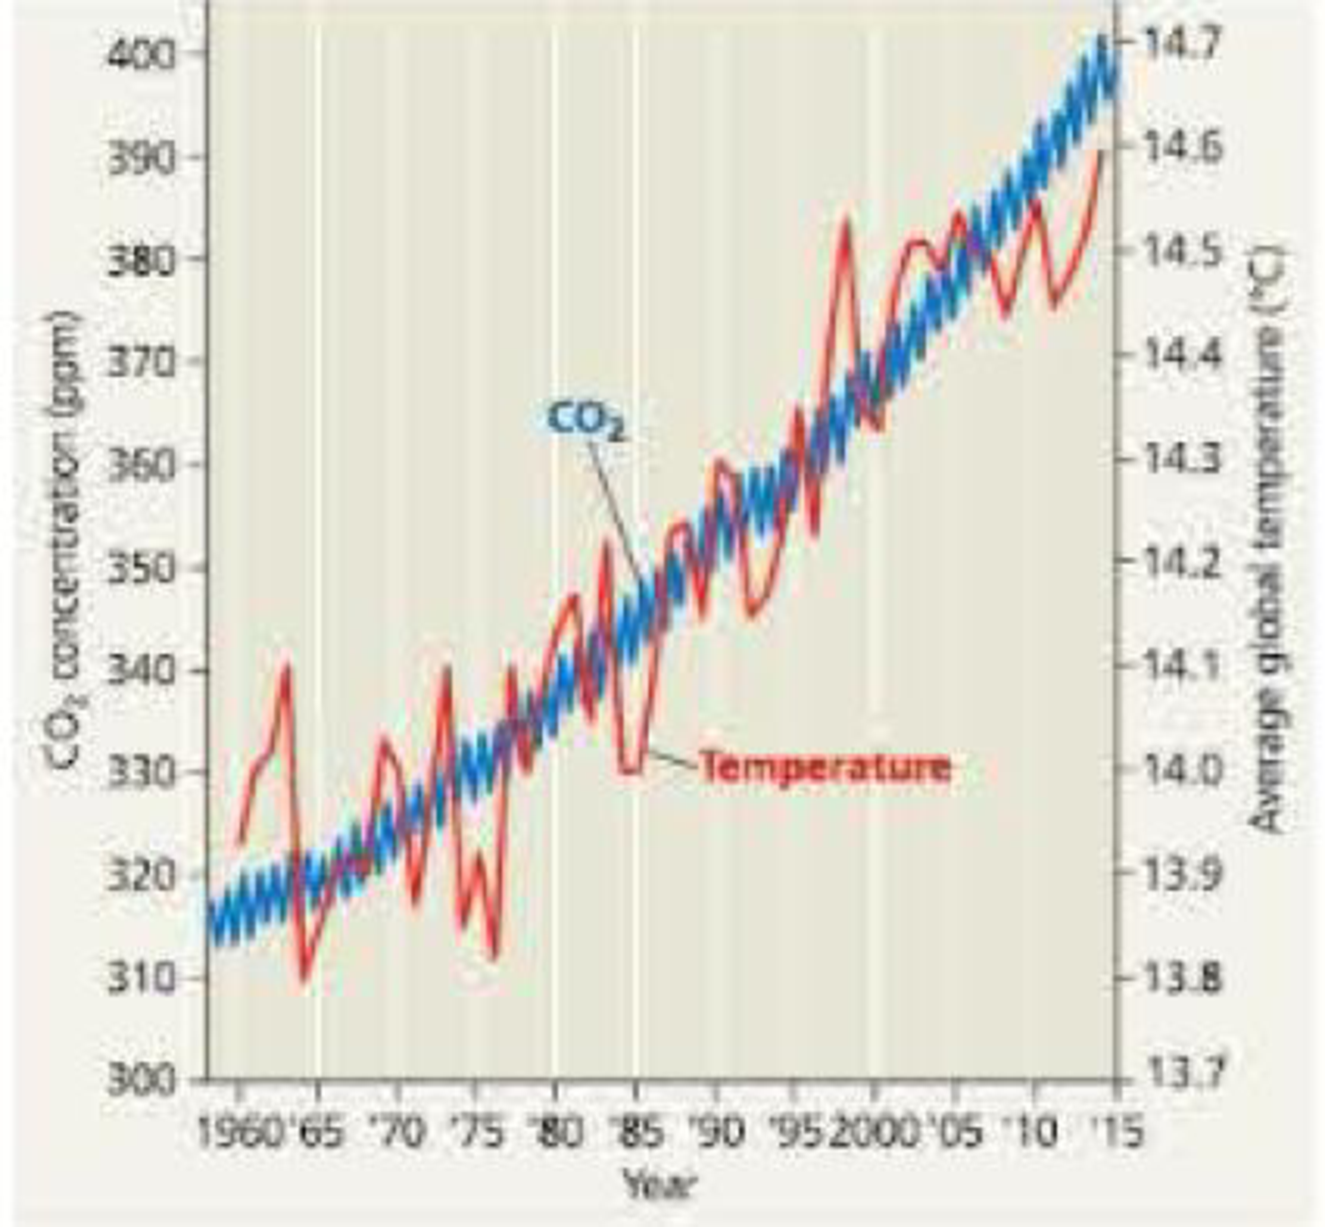
Figure 43.25 Increase in atmospheric carbon dioxide concentration at Mauna Loa, Hawaii, and average global temperatures.
Want to see the full answer?
Check out a sample textbook solution
Chapter 43 Solutions
Campbell Biology in Focus, Books a la Carte Edition; Modified Mastering Biology with Pearson eText - ValuePack Access Card - for Campbell Biology in Focus (2nd Edition)


- Propose a reason why the CO2 fluxes are greater for terrestrial biological activity than for marine biological activity.arrow_forwardEnvironmentally conscious Susan has been told that a newelectric car will only generate 6 ounces of greenhouse gases (GHG) permile, but that a standard internal combustion car is double that at 12ounces per mile. However, the nature of electric cars is such that the new technology and electric batteries generate 30,000 lbs. of GHG to manu-facture and another 10,000 lbs. to recycle. A standard car generates only 14,000 lbs. of GHG to manufacture, and recycling with established tech-nology is only 1,000 lbs. Susan is interested in taking a systems approach that considers the life-cycle impact of her decision. How many miles mustshe drive the electric car for it to be the preferable decision in terms ofreducing greenhouse gases?arrow_forwardThe carbon footprint is the amount of GHG produced from an activity or a product. What would be the carbon footprint of a power plant producing electricity from coal. Calculate the GHG emission of CO2 per kWh of electricity produced. Assume the energy efficiency of the power plant as 38% and the heating value of coal as 4500 Kcal/Kg. Assume coal is 50% carbon. The answer you will get is also known as the emission factor for a coal power plant.arrow_forward
- The current concentration of CO2 in the atmosphere is about 415 ppmv. It has been estimated that annual anthropogenic additions to the atmosphere are about 30 gigatonnes (Gt), of which about 15 Gt are removed into oceans and the terrestrial environment. a) Use these values to estimate the yearly net increase in atmospheric carbon dioxide mixing ratio, in ppmv. (note that 1 Gt = 1015g)arrow_forwardWhat % of CO2 is absorbed by the oceans from burning fossil fuels?arrow_forwardIf people stopped emitting CO2 next year, do you think that global temperature would begin to decline immediately? Why or why not?arrow_forward
- please draw! Model/diagram the sources and sinks of carbon in the global ecosystem. You will need to create TWO models/diagrams of the sources and sinks of carbon. In the first model diagram the sources and sinks of carbon in a natural, pre-industrial landscape. In the second model, diagram the sources and sinks of carbon in a landscape altered by human activity and industry. Finally, write a few short sentences on what you would expect the atmospheric levels of CO2 to be in each model and why they would or would not be similar.arrow_forwardwhat can we do to help reduce the amount of pollutants such as CO, SO2, NO2, HCl, NO3 in the atmosphere which alleviate Global warming? please explainarrow_forwardWhat is the major source of the CO2 that has accumulated in Earth’s atmosphere over the past two centuries?arrow_forward
- Do the state emissions rules impose on the efforts of the federal government to address global warming internationally? Who should regulate GHGs, the states or the federal government? Both? Neither? Discuss.arrow_forwardUsing the information in the table above, evaluate the relative risk for poor outside air quality for the following pairs of locations in terms of the pollutant sources. Which one do you think would have better air quality? Why? i) small village vs. large city ii) cabin in a forest with a wood-burning stove vs. farmhouse in the middle of the prairiesarrow_forwardPlease discuss the projected changes to the following observables, assuming the continuation of RCP8.5 over the next 80 years: Atmospheric CO2 concentration, mean global sea level, and mean global temperature.arrow_forward
 Human Anatomy & Physiology (11th Edition)BiologyISBN:9780134580999Author:Elaine N. Marieb, Katja N. HoehnPublisher:PEARSON
 Biology 2eBiologyISBN:9781947172517Author:Matthew Douglas, Jung Choi, Mary Ann ClarkPublisher:OpenStax
 Anatomy & PhysiologyBiologyISBN:9781259398629Author:McKinley, Michael P., O'loughlin, Valerie Dean, Bidle, Theresa StouterPublisher:Mcgraw Hill Education,
 Molecular Biology of the Cell (Sixth Edition)BiologyISBN:9780815344322Author:Bruce Alberts, Alexander D. Johnson, Julian Lewis, David Morgan, Martin Raff, Keith Roberts, Peter WalterPublisher:W. W. Norton & Company
 Laboratory Manual For Human Anatomy & PhysiologyBiologyISBN:9781260159363Author:Martin, Terry R., Prentice-craver, CynthiaPublisher:McGraw-Hill Publishing Co.
 Inquiry Into Life (16th Edition)BiologyISBN:9781260231700Author:Sylvia S. Mader, Michael WindelspechtPublisher:McGraw Hill Education