
Statistical Reasoning for Everyday Life (5th Edition)
5th Edition
ISBN: 9780134679259
Author: Bennett
Publisher: PEARSON
expand_more
expand_more
format_list_bulleted
Concept explainers
Videos
Textbook Question
Chapter 4.4, Problem 11E
Test Scores. The table below shows eighth-grade mathematics test scores in Nebraska and New Jersey. The scores are separated according to the race of the student. Also shown are the state averages for all races.
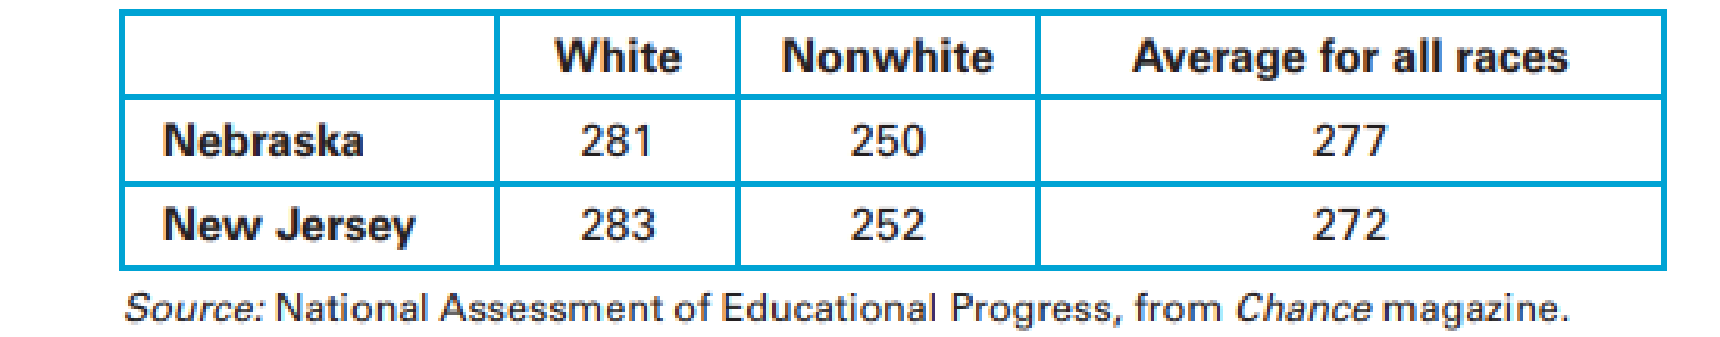
- a. Which state had the higher scores in both racial categories? Which state had the higher overall average across both racial categories?
- b. Explain how a state could score lower in both categories and still have a higher overall average.
- c. Now consider the table below, which gives the percentages of whites and nonwhites in each state. Use these percentages to verify that the overall average test score in Nebraska is 277, as claimed in the first table.

- d. Use the racial percentages to verify that the overall average test score in New Jersey is 272, as claimed in the first table.
Expert Solution & Answer
Want to see the full answer?
Check out a sample textbook solution
Chapter 4 Solutions
Statistical Reasoning for Everyday Life (5th Edition)
Ch. 4.1 - Average. Define and distinguish among mean,...Ch. 4.1 - Outliers. What are outliers? Describe the effects...Ch. 4.1 - Average Confusion. Briefly describe at least two...Ch. 4.1 - Weighting. What is a weighted mean, and when is it...Ch. 4.1 - Does It Make Sense? For Exercises 59, determine...Ch. 4.1 - Does It Make Sense? For Exercises 59, determine...Ch. 4.1 - Mode. In an analysis of salaries paid to sales...Ch. 4.1 - Employment Data. A survey asked people their...Ch. 4.1 - Mean Wage. To find the mean wage of restaurant...Ch. 4.1 - Mean, Median, and Mode. In Exercises 1016, find...
Ch. 4.1 - Mean, Median, and Mode. In Exercises 1016, find...Ch. 4.1 - Mean, Median, and Mode. In Exercises 1016, find...Ch. 4.1 - Mean, Median, and Mode. In Exercises 1016, find...Ch. 4.1 - Mean, Median, and Mode. In Exercises 1016, find...Ch. 4.1 - Mean, Median, and Mode. In Exercises 1016, find...Ch. 4.1 - Mean, Median, and Mode. In Exercises 1016, find...Ch. 4.1 - Cell Phone Radiation. Listed below are...Ch. 4.1 - Alphabetic States. The states of Alabama, Alaska,...Ch. 4.1 - Outlier Coke. The contents of cans of regular...Ch. 4.1 - Raising Your Grade. Suppose you have scores of 80,...Ch. 4.1 - Raising Your Grade. Suppose you have scores of 60,...Ch. 4.1 - Comparing Data. In Exercises 2225, find the mean...Ch. 4.1 - Comparing Data. In Exercises 2225, find the mean...Ch. 4.1 - Comparing Data. In Exercises 2225, find the mean...Ch. 4.1 - Prob. 25ECh. 4.1 - Weighted Mean. Compute the weighte means in...Ch. 4.1 - Class Grade. Ryan is taking an advanced math class...Ch. 4.1 - GPA. One common system for computing a grade point...Ch. 4.1 - Prob. 29ECh. 4.1 - Prob. 30ECh. 4.1 - 31. Stockholder Voting. A small company has six...Ch. 4.1 - Weighted Mean. In Exercises 3235, find the mean of...Ch. 4.1 - Weighted Mean. In Exercises 3235, find the mean of...Ch. 4.1 - Weighted Mean. In Exercises 3235, find the mean of...Ch. 4.1 - Weighted Mean. In Exercises 3235, find the mean of...Ch. 4.1 - U.S. Population Center. Imagine taking a huge flat...Ch. 4.2 - Modes. Distinguish between a uniform distribution...Ch. 4.2 - Prob. 2ECh. 4.2 - Prob. 3ECh. 4.2 - Prob. 4ECh. 4.2 - Prob. 5ECh. 4.2 - Does It Make Sense? For Exercises 58, determine...Ch. 4.2 - Does It Make Sense? For Exercises 58, determine...Ch. 4.2 - Does It Make Sense? For Exercises 58, determine...Ch. 4.2 - Prob. 9ECh. 4.2 - Distributions. In Exercises 912, describe the...Ch. 4.2 - Distributions. In Exercises 912, describe the...Ch. 4.2 - Distributions. In Exercises 912, describe the...Ch. 4.2 - Baseball Salaries. In a recent year, the 868...Ch. 4.2 - Boston Rainfall. The daily rainfall amounts (in...Ch. 4.2 - Describing Distributions. For each distribution...Ch. 4.2 - Describing Distributions. For each distribution...Ch. 4.2 - Describing Distributions. For each distribution...Ch. 4.2 - Describing Distributions. For each distribution...Ch. 4.2 - Describing Distributions. For each distribution...Ch. 4.2 - Describing Distributions. For each distribution...Ch. 4.2 - Describing Distributions. For each distribution...Ch. 4.2 - Describing Distributions. For each distribution...Ch. 4.2 - Describing Distributions. For each distribution...Ch. 4.2 - Describing Distributions. For each distribution...Ch. 4.2 - Describing Distributions. For each distribution...Ch. 4.2 - Describing Distributions. For each distribution...Ch. 4.3 - Variation Matters. Consider two grocery stores at...Ch. 4.3 - Variation Measures. Briefly distinguish between...Ch. 4.3 - Quartiles and Percentiles. Briefly describe how...Ch. 4.3 - Standard Deviation. Describe the process of...Ch. 4.3 - Does It Make Sense? For Exercises 58, determine...Ch. 4.3 - Does It Make Sense? For Exercises 58, determine...Ch. 4.3 - Does It Make Sense? For Exercises 58, determine...Ch. 4.3 - Does It Make Sense? For Exercises 58, determine...Ch. 4.3 - Prob. 9ECh. 4.3 - Range and Standard Deviation. Exercises 916 each...Ch. 4.3 - Range and Standard Deviation. Exercises 916 each...Ch. 4.3 - Range and Standard Deviation. Exercises 916 each...Ch. 4.3 - Range and Standard Deviation. Exercises 916 each...Ch. 4.3 - Range and Standard Deviation. Exercises 916 each...Ch. 4.3 - Range and Standard Deviation. Exercises 916 each...Ch. 4.3 - Range and Standard Deviation. Exercises 916 each...Ch. 4.3 - Prob. 17ECh. 4.3 - Comparing Variation. In Exercises 1720, find the...Ch. 4.3 - Prob. 19ECh. 4.3 - Comparing Variation. In Exercises 1720, find the...Ch. 4.3 - Calculating Percentiles. A statistics professor...Ch. 4.3 - Calculating Percentiles. A data set consists of...Ch. 4.3 - Understanding Standard Deviation. The following...Ch. 4.3 - Understanding Standard Deviation. The following...Ch. 4.3 - Comparing Data Sets. For each of Exercises 2528,...Ch. 4.3 - Comparing Data Sets. For each of Exercises 2528,...Ch. 4.3 - Comparing Data Sets. For each of Exercises 2528,...Ch. 4.3 - Comparing Data Sets. For each of Exercises 2528,...Ch. 4.3 - Manufacturing. You are in charge of a...Ch. 4.3 - Prob. 30ECh. 4.3 - Prob. 31ECh. 4.3 - Prob. 32ECh. 4.4 - False Positive and False Negative. Professional...Ch. 4.4 - Positive Test Result. A professional soccer player...Ch. 4.4 - Prob. 3ECh. 4.4 - Prob. 4ECh. 4.4 - Does It Make Sense? For Exercises 58, determine...Ch. 4.4 - Does It Make Sense? For Exercises 58, determine...Ch. 4.4 - Does It Make Sense? For Exercises 58, determine...Ch. 4.4 - Does It Make Sense? For Exercises 58, determine...Ch. 4.4 - Prob. 9ECh. 4.4 - Passing Percentages. The table below shows the...Ch. 4.4 - Test Scores. The table below shows eighth-grade...Ch. 4.4 - Test Scores. Consider the following table...Ch. 4.4 - Prob. 13ECh. 4.4 - Prob. 14ECh. 4.4 - Basketball Records. Consider the following...Ch. 4.4 - Better Drug. Two drugs, A and B, were tested on a...Ch. 4.4 - Prob. 17ECh. 4.4 - Disease Test. Suppose a test for a disease is 80%...Ch. 4.4 - Prob. 19ECh. 4.4 - Drug Trials. (This problem is based on an example...Ch. 4.4 - HIV Risks. The New York State Department of Health...Ch. 4 - Chocolate Chips. Listed below are counts of the...Ch. 4 - Prob. 2CRECh. 4 - a. What is the standard deviation for a data set...Ch. 4 - When you add the earthquake magnitudes 2.45, 3.62,...Ch. 4 - Prob. 2CQCh. 4 - Prob. 3CQCh. 4 - Prob. 4CQCh. 4 - Prob. 5CQCh. 4 - Prob. 6CQCh. 4 - A histogram is constructed for a large set of...Ch. 4 - Prob. 8CQCh. 4 - Prob. 9CQCh. 4 - Identify the names of the components that...
Knowledge Booster


Learn more about
Need a deep-dive on the concept behind this application? Look no further. Learn more about this topic, statistics and related others by exploring similar questions and additional content below.Recommended textbooks for you
 Holt Mcdougal Larson Pre-algebra: Student Edition...AlgebraISBN:9780547587776Author:HOLT MCDOUGALPublisher:HOLT MCDOUGAL
 Glencoe Algebra 1, Student Edition, 9780079039897...AlgebraISBN:9780079039897Author:CarterPublisher:McGraw Hill
 Functions and Change: A Modeling Approach to Coll...AlgebraISBN:9781337111348Author:Bruce Crauder, Benny Evans, Alan NoellPublisher:Cengage Learning
 Big Ideas Math A Bridge To Success Algebra 1: Stu...AlgebraISBN:9781680331141Author:HOUGHTON MIFFLIN HARCOURTPublisher:Houghton Mifflin Harcourt
 Algebra & Trigonometry with Analytic GeometryAlgebraISBN:9781133382119Author:SwokowskiPublisher:Cengage
Holt Mcdougal Larson Pre-algebra: Student Edition...
Algebra
ISBN:9780547587776
Author:HOLT MCDOUGAL
Publisher:HOLT MCDOUGAL
Glencoe Algebra 1, Student Edition, 9780079039897...
Algebra
ISBN:9780079039897
Author:Carter
Publisher:McGraw Hill
Functions and Change: A Modeling Approach to Coll...
Algebra
ISBN:9781337111348
Author:Bruce Crauder, Benny Evans, Alan Noell
Publisher:Cengage Learning
Big Ideas Math A Bridge To Success Algebra 1: Stu...
Algebra
ISBN:9781680331141
Author:HOUGHTON MIFFLIN HARCOURT
Publisher:Houghton Mifflin Harcourt
Algebra & Trigonometry with Analytic Geometry
Algebra
ISBN:9781133382119
Author:Swokowski
Publisher:Cengage
Sampling Methods and Bias with Surveys: Crash Course Statistics #10; Author: CrashCourse;https://www.youtube.com/watch?v=Rf-fIpB4D50;License: Standard YouTube License, CC-BY
Statistics: Sampling Methods; Author: Mathispower4u;https://www.youtube.com/watch?v=s6ApdTvgvOs;License: Standard YouTube License, CC-BY