
Concept explainers
Videos
Shown, again, in the following table is world population, in billions, for seven selected years from 1950 through 2010. Using a graphing utility's logistic regression option, we obtain the equation shown on the screen.
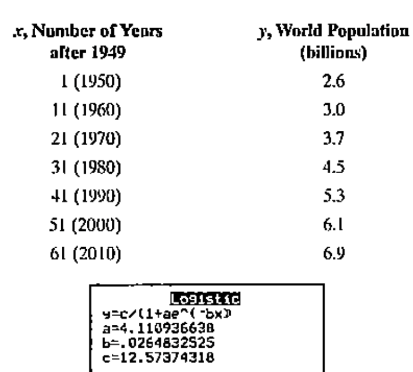
We see from the calculator screen at the bottom of the previous page that a logistic growth model for world population, f(x), in billions, x years after 1949 is
Use this function to solve Exercises 33-42.
According to the model, what is the limiting size of the population that Earth will eventually sustain?
Want to see the full answer?
Check out a sample textbook solution
Chapter 4 Solutions
Algebra and Trigonometry - With MyMathLab


- The table shows the mid-year populations (in millions) of five countries in 2015 and the projected populations (in millions) for the year 2025. (a) Find the exponential growth or decay model y=aebt or y=aebt for the population of each country by letting t=15 correspond to 2015. Use the model to predict the population of each country in 2035. (b) You can see that the populations of the United States and the United Kingdom are growing at different rates. What constant in the equation y=aebt gives the growth rate? Discuss the relationship between the different growth rates and the magnitude of the constant.arrow_forwardTable 6 shows the population, in thousands, of harbor seals in the Wadden Sea over the years 1997 to 2012. a. Let x represent time in years starting with x=0 for the year 1997. Let y represent the number of seals in thousands. Use logistic regression to fit a model to these data. b. Use the model to predict the seal population for the year 2020. c. To the nearest whole number, what is the limiting value of this model?arrow_forwardSales of a video game released in the year 2000 took off at first, but then steadily slowed as time moved on. Table 4 shows the number of games sold, in thousands, from the years 20002010. a. Let x represent time in years starting with x=1 for the year 2000. Let y represent the number of games sold in thousands. Use logarithmic regression to fit a model to these data. b. If games continue to sell at this rate, how many games will sell in 2015? Round to the nearest thousand.arrow_forward
- What is the y -intercept of the logistic growth model y=c1+aerx ? Show the steps for calculation. What does this point tell us about the population?arrow_forwardWhat is the carrying capacity for a population modeled by the logistic equation P(t)=250,0001+499e0.45t ? initial population for the model?arrow_forwardTo the nearest whole number, what is the initial value of a population modeled by the logistic equation P(t)=1751+6.995e0.68t ? What is the carrying capacity?arrow_forward
 Algebra & Trigonometry with Analytic GeometryAlgebraISBN:9781133382119Author:SwokowskiPublisher:Cengage

 Linear Algebra: A Modern IntroductionAlgebraISBN:9781285463247Author:David PoolePublisher:Cengage Learning
 Glencoe Algebra 1, Student Edition, 9780079039897...AlgebraISBN:9780079039897Author:CarterPublisher:McGraw Hill