
Videos
The authors of the paper “Delayed Time to Defibrillation after In-Hospital Cardiac Arrest” (New England Journal of Medicine [2008]: 9–16) described a study of how survival is related to the length of time it takes from the time of a heart attack to the administration of defibrillation therapy. The following is a statement from the paper:
We identified 6789 patients from 369 hospitals who had in-hospital cardiac arrest due to ventricular fibrillation (69.7%) or pulseless ventricular trachycardia (30.3%). Overall, the
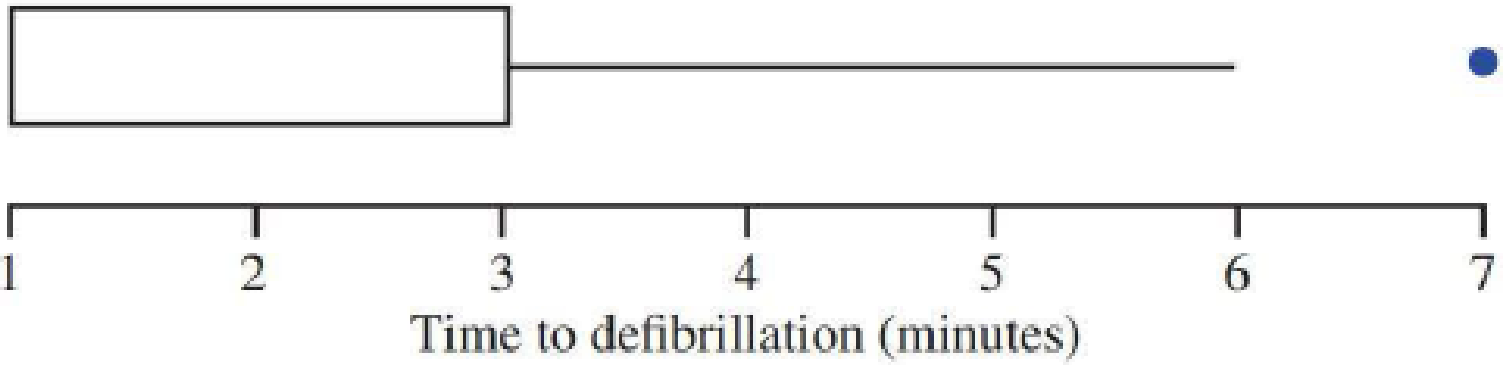
Data from the paper on time to defibrillation in minutes) for these 6789 patients was used to produce the Minitab output and boxplot at the bottom of the page.
- a. Why is there no lower whisker in the given boxplot?
- b. How is it possible for the median, the lower quartile, and the minimum value in the data set to all be equal? (Note—this is why you do not see a median line in the box part of the boxplot.)
- c. The authors of the paper considered a time to defibrillation of greater than 2 minutes as unacceptable. Based on the given boxplot and summary statistics, is it possible that the percentage of patients having an unacceptable time to defibrillation is greater than 50%? Greater than 25%? Less than 25%? Explain.
- d. Is the outlier shown at 7 a mild outlier or an extreme outlier?


Trending nowThis is a popular solution!

Chapter 4 Solutions
Introduction to Statistics and Data Analysis
Additional Math Textbook Solutions
Elementary Statistics (13th Edition)
Essential Statistics
Elementary Statistics: Picturing the World (6th Edition)
Statistical Reasoning for Everyday Life (5th Edition)
Statistics Through Applications
Statistics for Business & Economics, Revised (MindTap Course List)


- A recent study set out to investigate the association between smoking and the development of coronary artery disease (CAD), the leading cause of heart attacks among adults in the US. Upon enrollment in the study, 1,232 adult participants were asked to report whether they had ever smoked more than one pack of cigarettes in the lifetimes. The participants were then examined for the development of CAD once a year for the following twenty years. Examinations found 106 cases of CAD among the 368 participants who had never smoked and 419 cases of CAD among the 864 participants who had ever smoked. 6) What type of study design was used? Explain. 7) Set up the 2X2 contingency table for the data. 8) For this type of study design, what is the appropriate measure to describe the strength of the association between the exposure and the disease? 9) Calculate the measure identified in question 8. 10) Interpret the measure calculated in question 9.arrow_forwardA study investigated the joint effects of sleep quality and sleep duration on the development of coronary heart disease (CHD). A total of 60,586 individuals aged 40 and older with no current or prior history of CHD were enrolled into the study. A self-administered questionnaire was used to collect information on sleep quality and duration at the start of the study, and 43,910 participants reported getting ³6 hours of sleep per day. Participants were followed for approximately 12 years, for a total of 152,000 person-years among those getting <6 hours sleep/day and 527,000 person-years among those getting ³6 hours sleep/day. Out of 2,740 participants who developed CHD throughout follow-up, 721 participants reported getting <6 hours of sleep per day at baseline. Question 10: What is the incidence rate of coronary heart disease among all participants in the study?arrow_forwardA recent study investigated the association between sudden cardiac death and smoking history in women from a large health system. The epidemiologist reviewed the electronic health records of women who died from sudden cardiac death (n=80) and women who died of non-cardiac causes (n=80). The investigator then reviewed these records for smoking history (smoking 1+ pack/day and smoking <1 pack/day) and identified the following results. Sudden Cardiac Death 38 42 Smoke 1+ pack/day Smoke <1 pack/day Calculate the most appropriate measure of association for these data (a)-round to the nearest tenth. Other Causes 10 70arrow_forward
- Colonoscopy is a medical procedure that is designed to find and remove precancerous lesions in the colon before they become cancerous. The article “Association of Colonoscopy and Death from Colorectal Cancer” (N. Baxter, M. Goldwasser, et al., Annals of Internal Medicine, 2009:1–8) reports that in a sample of 10,292 people diagnosed with colorectal cancer, 7.0% had previously had a colonoscopy, and in a sample of 51,460 people without colorectal cancer, 9.8% had previously had a colonoscopy. Can you conclude that the percentage of people who have had colonoscopies is greater in those without colorectal cancer?arrow_forwardA paper describes a study of the use of MRI (Magnetic Resonance Imaging) exams in the diagnosis of breast cancer. The purpose of the study was to determine if MRI exams do a better job than mammograms of determining if women who have recently been diagnosed with cancer in one breast have cancer in the other breast. The study participants were 940 women who had been diagnosed with cancer in one breast and for whom a mammogram did not detect cancer in the other breast.These women had an MRI exam of the other breast, and 111 of those exams indicated possible cancer. After undergoing biopsies, it was determined that 30 of the 111 did in fact have cancer in the other breast, whereas 81 did not. The women were all followed for one year, and four of the women for whom the MRI exam did not indicate cancer in the other breast were subsequently diagnosed with cancer that the MRI did not detect. The accompanying table summarizes this information. CancerPresent Cancer NotPresent Total MRI…arrow_forwardResearchers have noted a decline in cognitive functioning as people age (Bartus, 1990). However, the results from other research suggest that the antioxidants in foods such as blueberries may reduce and even reverse these age-related declines (Joseph et al., 1999). To examine this phenomenon, suppose that a researcher obtains a sample of n = 16 adults who are between the ages of 65 and 75. The researcher uses a standardized test to measure cognitive performance for each individual. The participants then begin a 2-month program in which they receive daily doses of a blueberry supplement. At the end of the 2-month period, the researcher again measures cognitive performance for each participant. The results show an average increase in performance of Mp = 7.4 with SS = 1215. a. Does this result support the conclusion that the antioxidant supplement has a significant effect on cognitive performance? Use a two-tailed test with a = = .05. (1) Ho: (Select] ( Select ] [ Select ] H: ( Select ] […arrow_forward
- Researchers have noted a decline in cognitive functioning as people age (Bartus, 1990). However, the results from other research suggest that the antioxidants in foods such as blueberries may reduce and even reverse these age-related declines (Joseph et al., 1999). To examine this phenomenon, suppose that a researcher obtains a sample of n = 16 adults who are between the ages of 65 and 75. The researcher uses a standardized test to measure cognitive performance for each individual. The participants then begin a 2-month program in which they receive daily doses of a blueberry supplement. At the end of the 2-month period, the researcher again measures cognitive performance for each participant. The results show an average increase in performance of MD = 7.4 with SS = 1215. Does this result support the conclusion that the antioxidant supplement has a significant effect on cognitive performance? Use a two-tailed test with α = .05. Show your computations.arrow_forward1. Does the herb Echinacea help the common cold? A study investigated the impact of echinacea vs. a standard cold medication on cold symptoms. Each subject in the study chose to take either the echinacea or a standard cold medication in capsule form After taking the capsule for one week, the subjects then reported to the researchers the status of their cold symptoms. The researchers subsequently reported that there was no statistically significant difference in the duration of the cold between these groups. The variable duration of cold in this study would be the a) Explanatory variable b) Response variable c) Population d) Statisticarrow_forwardA paper describes a study of the use of MRI (Magnetic Resonance Imaging) exams in the diagnosis of breast cancer. The purpose of the study was to determine if MRI exams do a better job than mammograms of determining if women who have recently been diagnosed with cancer in one breast have cancer in the other breast. The study participants were 950 women who had been diagnosed with cancer in one breast and for whom a mammogram did not detect cancer in the other breast. These women had an MRI exam of the other breast, and 101 of those exams indicated possible cancer. After undergoing biopsies, it was determined that 30 of the 101 did in fact have cancer in the other breast, whereas 71 did not. The women were all followed for one year, and four of the women for whom the MRI exam did not indicate cancer in the other breast were subsequently diagnosed with cancer that the MRI did not detect. The accompanying table summarizes this information. Cancer Cancer Not Present Present Total MRI…arrow_forward
- A researcher collected health information from 30 randomly selected patients living with diabetes. Reported below are the fasting glucose levels (mg/dL) for 15 males and 15 females. You want to know if there is a difference in fasting glucose levels between males and females. Fasting Fasting Gender Glucose (mg/dL) Gender Glucose (mg/dL) Male 74 Female 88 Male 72 Female 112 Male 66 Female 114 Male 90 Female 97 Male 86 Female 121 Male 87 Female 109 Male 101 Female 72 Male 99 Female 75 Male 108 Female 97 40 Male 101 Female 73 Male 78 Female 71 Male 112 Female 64 Male 75 Female 98 Male 73 Female 101 Male 88 Female 81 Variance = 204.81 Variance = 327.84arrow_forwardA heart study objective was to study heart disease among healthy volunteers.After a 10-year follow-up period involving men aged 40 to 59, there were 16 casesof coronary heart disease (CHD) among the 454 men who initially had cholesterollevels below 210 mg/100 ml (referred to as the low serum cholesterol group). Incontrast, among the 424 men whose initial cholesterol levels were at least 245mg/100 ml (referred to as the high serum cholesterol group), there were 51 cases ofCHD. With this information, Draw a 2x2 contingency table then calculate the relative risk (RR) associated with high serum cholesterol and provide an interpretation of the result.arrow_forwardA clinical trial of gamma globulin in the treatment of children with Kawasaki syndrome randomized approximately half of the patients to receive gamma globulin. The standard treatment is an aspirin regimen; however, about one quarter of these patients developed coronary abnormalities even, under the standard treatment. The outcome of interest was the development of coronary abnormalities (CA) over a 7-week follow-up period. The following 2 x 2 table summarizes the results. a) Calculate the odds of developing coronary abnormalities for those who took gamma globulin. Calculate the odds of developing coronary abnormalities for those who took aspirin. (b) Calculate the sample OR for developing coronary abnormalities comparing those on gamma globulin compared to those on aspirin. (c) Investigators constructed the following logistic model: where Logit(i) = log [i / (1 - i) ] = = – 1.0076 – 1.4030 GG Does it make sense to interpret the intercept in this model? If…arrow_forward
 Linear Algebra: A Modern IntroductionAlgebraISBN:9781285463247Author:David PoolePublisher:Cengage Learning
 Holt Mcdougal Larson Pre-algebra: Student Edition...AlgebraISBN:9780547587776Author:HOLT MCDOUGALPublisher:HOLT MCDOUGAL
 Glencoe Algebra 1, Student Edition, 9780079039897...AlgebraISBN:9780079039897Author:CarterPublisher:McGraw Hill