
Videos
a.
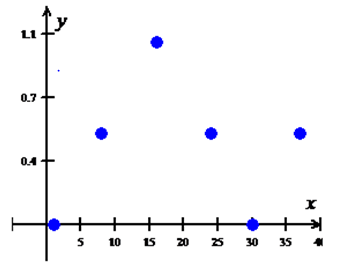
Create a scatter plot of the data.
a.
Answer to Problem 83E

Explanation of Solution
Given information:
The table shows the percent y (in decimal form) of the moon’s face illuminated on day x in the year 2018, where x = 1 corresponds to January 1. (Source: U.S. Naval Observatory)
Create a scatter plot of the data.
Calculation:
Below table shows the percent
Plot the points in coordinate plane.
Scatter plot is as shown below:
b.
Find a trigonometric model for the data.
b.
Answer to Problem 83E
Explanation of Solution
Given information:
The table shows the percent y (in decimal form) of the moon’s face illuminated on day x in the year 2018, where x = 1 corresponds to January 1. (Source: U.S. Naval Observatory)Create a scatter plot of the data.
Find a trigonometric model for the data.
Calculation:
Below table shows the percent
Consider the sine model
Here maximum percent is
Thus the amplitude is
Here one cycle is completed between two minimum percents.
Here starting point is at
Let the left endpoint is
Average of minimum and maximum values is
Hence, the value of
Required sine function is
c.
How well does the model fit the data?
c.
Answer to Problem 83E
Explanation of Solution
Given information:
The table shows the percent y (in decimal form) of the moon’s face illuminated on day x in the year 2018, where x = 1 corresponds to January 1. (Source: U.S. Naval Observatory)Create a scatter plot of the data.
Add the graph of your model in part (b) to the scatter plot. How well does the model fit the data?
Calculation:
Below table shows the percent
Graph is as shown below:
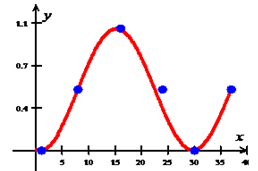
Hence, the equation fit the data
d.
What is the period of the model?
d.
Answer to Problem 83E
Explanation of Solution
Given information:
The table shows the percent y (in decimal form) of the moon’s face illuminated on day x in the year 2018, where x = 1 corresponds to January 1. (Source: U.S. Naval Observatory)Create a scatter plot of the data.
What is the period of the model?
Calculation:
Below table shows the percent
Period of the model is
Hence, the period is
e.
Estimate the percent of the moon’s face illuminated on March 12, 2018.
e.
Answer to Problem 83E
Explanation of Solution
Given information:
The table shows the percent y (in decimal form) of the moon’s face illuminated on day x in the year 2018, where x = 1 corresponds to January 1. (Source: U.S. Naval Observatory)Create a scatter plot of the data.
Estimate the percent of the moon’s face illuminated on March 12, 2018.
Calculation:
Below table shows the percent
Here March 12 corresponds to the day
Substitute
Hence the percent of illumination on March 12, 2014 is
Chapter 4 Solutions
EBK PRECALCULUS W/LIMITS


 Calculus: Early TranscendentalsCalculusISBN:9781285741550Author:James StewartPublisher:Cengage Learning
 Thomas' Calculus (14th Edition)CalculusISBN:9780134438986Author:Joel R. Hass, Christopher E. Heil, Maurice D. WeirPublisher:PEARSON
 Calculus: Early Transcendentals (3rd Edition)CalculusISBN:9780134763644Author:William L. Briggs, Lyle Cochran, Bernard Gillett, Eric SchulzPublisher:PEARSON
 Calculus: Early TranscendentalsCalculusISBN:9781319050740Author:Jon Rogawski, Colin Adams, Robert FranzosaPublisher:W. H. Freeman
 Calculus: Early Transcendental FunctionsCalculusISBN:9781337552516Author:Ron Larson, Bruce H. EdwardsPublisher:Cengage Learning