
Videos
Objective 4: Create Exponential and Logarithmic Models Using Regression
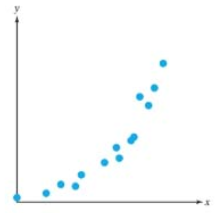
For Exercises 35-38, a graph of data is given. From visual inspection, which model would best fit the data? Choose from
Want to see the full answer?
Check out a sample textbook solution
Chapter 4 Solutions
COLLEGE ALGEBRA (LOOSE)-W/ACCESS
Additional Math Textbook Solutions
Prealgebra (7th Edition)
Elementary and Intermediate Algebra: Concepts and Applications (7th Edition)
Linear Algebra with Applications (9th Edition) (Featured Titles for Linear Algebra (Introductory))
Graphical Approach To College Algebra
Pre-Algebra, Student Edition
College Algebra (5th Edition)


- Special Rounding Instructions For this exercise set, round all regression parameters to three decimal places, but round all other answers to two decimal places unless otherwise indicated. Cell phones The following table shows the number, in millions, of cell phone subscribers in the United States at the end of the given year. Year Subscribersmillions 2010 296.3 2011 316.0 2012 326.5 2013 335.6 2014 355.4 a.Plot the data points. b.Use exponential regression to construct an exponential model for the subscriber data. c.Add the graph of the exponential model to the plot in part a. d.What was the yearly percentage growth rate from the end of 2010 through the end of 2014 for cell phone subscribership? e.In 2014, an executive had a plan that could make money for the company, provided that there would be at least 380million cell phone subscribers by the end of 2016. Solely on the basis of an exponential model for the data in the table, would it be reasonable for the executive to implement the plan?arrow_forwardSales of a video game released in the year 2000 took off at first, but then steadily slowed as time moved on. Table 4 shows the number of games sold, in thousands, from the years 20002010. a. Let x represent time in years starting with x=1 for the year 2000. Let y represent the number of games sold in thousands. Use logarithmic regression to fit a model to these data. b. If games continue to sell at this rate, how many games will sell in 2015? Round to the nearest thousand.arrow_forwardWhat is the y -intercept of the logistic growth model y=c1+aerx ? Show the steps for calculation. What does this point tell us about the population?arrow_forward
- Special Rounding Instructions When you perform logistic regression, round the r value to three decimal places and the other parameters to two decimal places. Round all answers to two decimal places unless other-wise indicated. African Bees There are 3600 commercial bee hives in a region threatened by African bees. Today African bees have taken over 50 hives. Experience in other areas shows that, in the absence of limiting factors, the African bees will increase the number of hives they take over by 30 each year. Make a logistic model that shows the number of hives taken over by African bees after t years, and determine how long it will be before 1800 hives are affected.arrow_forwardSpecial Rounding Instructions When you perform logistic regression, round the r value to three decimal places and the other parameters to two decimal places. Round all answers to two decimal places unless other-wise indicated. Fluorescent Bulbs Compact fluorescent light bulbs save energy when compared with traditional incandescent bulbs. Our green energy campaign includes efforts to get local residents to exchange their incandescent bulbs fur fluorescent bulbs. Initially 200 households make the change. Market studies suggest that, in the absence of limiting factors, we could increase that number by 25 each month. In our target area, there are 250,000 households, which we take as the limiting value. Make a logistic model that gives the number of households converting to fluorescent bulbs after t months.arrow_forwardSpecial Rounding Instructions For this exercise set, round all regression parameters to three decimal places, but round all other answers to two decimal places unless otherwise indicated. National Health Care SpendingThe following table shows national health care costs, measured in billions of dollars. Date 1970 1980 1990 2000 2010 Costs, in billions 75 253 714 1353 2570 a.Plot the data. b.Find an exponential function that approximates the data for health care costs. c.By what percentage per year were national health care costs increasing during the period from 1970 through 2010? d.Use functional notation to express how much money was spent on health care in the year 2011, and then estimate that value.arrow_forward
- Special Rounding Instructions For this exercise set, round all regression parameters to three decimal places, but round all other answers to two decimal places unless otherwise indicated. Cost of Scientific periodicals The table below shows the average cost C, in dollars, of chemistry and physics periodicals tyears after 1980. 29 t=yearssince1980 C=cost,indollars 0 140 5 250 10 410 15 780 20 1300 22 1520 a.Make an exponential model of C as a function of t. b.Plot the data and the exponential model. c.What was the yearly percentage growth rate of the cost of chemistry and physics periodicals? d.If this exponential trend continues, what will be the expected average cost of physics and chemistry periodicals in 2020? Round your answer to the nearest dollar.arrow_forwardWhat situations are best modeled by a logistic equation? Give an example, and state a case for why the example is a good fit.arrow_forwardSpecial Rounding Instructions When you perform logistic regression, round the r value to three decimal places and the other parameters to two decimal places. Round all answers to two decimal places unless other-wise indicated. An Epidemic In a city of half a million, there are initially 800 cases of a particularly virulent strain of flu. The Centers for Disease Control and Prevention in Atlanta claims that the cumulative number of infections with this flu strain will increase by 40 per week if there are no limiting factors. Make a logistic model of the potential cumulative number of cases of flu as a function of weeks from initial outbreak, and determine how long it will be before 100, 000 people are infected.arrow_forward
- Special Rounding Instructions For this exercise set, round all regression parameters to three decimal places, but round all other answers to two decimal places unless otherwise indicated. Medicare ExpendituresThe following table is from the Centers for Medicare that is, M=1000?arrow_forwardSpecial Rounding Instructions For this exercise set, round all regression parameters to three decimal places, but round all other answers to two decimal places unless otherwise indicated. Household IncomeThe following table shows the median income, in thousands of dollars, of American families for 2003 through 2008. Year Incomethousands of dollars 2003 52.68 2004 54.06 2005 56.19 2006 58.41 2007 61.36 2008 61.52 a.Plot the data. b.Use exponential regression to construct an exponential model for the income data. c.What was the yearly percentage growth rate in median family income during this period? d.From 2003 through 2008, inflation was about 3 per year. Did median family income keep pace with inflation during this period?arrow_forwardGrowth Rate Versus Weight Ecologists have studied how a populations intrinsic exponential growth rate r is related to the body weight W for herbivorous mammals. In table 5.2, W is the adult weight measured in pounds, and r is growth rate per year. Animal Weight W r Short-tailed vole 0.07 4.56 Norway rat 0.7 3.91 Rue deer 55 0.23 White-tailed deer 165 0.55 American elk 595 0.27 African elephant 8160 0.06 Find a formula that models r as a power function of W, and draw a graph of this function.arrow_forward
 Functions and Change: A Modeling Approach to Coll...AlgebraISBN:9781337111348Author:Bruce Crauder, Benny Evans, Alan NoellPublisher:Cengage Learning
 Algebra & Trigonometry with Analytic GeometryAlgebraISBN:9781133382119Author:SwokowskiPublisher:Cengage
 Glencoe Algebra 1, Student Edition, 9780079039897...AlgebraISBN:9780079039897Author:CarterPublisher:McGraw Hill