
Videos
Objective 4: Create Exponential and Logarithmic Models Using Regression
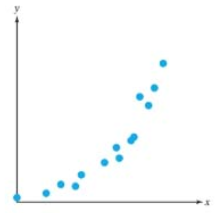
For Exercises 35-38, a graph of data is given. From visual inspection, which model would best fit the data? Choose from
Want to see the full answer?
Check out a sample textbook solution
Chapter 4 Solutions
COLLEGE ALGEBRA CUSTOM TEXT WITH ALEKS 3
Additional Math Textbook Solutions
Prealgebra (7th Edition)
Elementary and Intermediate Algebra: Concepts and Applications (7th Edition)
Linear Algebra with Applications (9th Edition) (Featured Titles for Linear Algebra (Introductory))
Graphical Approach To College Algebra
Pre-Algebra, Student Edition
College Algebra (5th Edition)


- Table 2 shows a recent graduate’s credit card balance each month after graduation. a. Use exponential regression to fit a model to these data. b. If spending continues at this rate, what will the graduate’s credit card debt be one year after graduating?arrow_forwardWhat is regression analysis? Describe the process of performing regression analysis on a graphing utility.arrow_forwardWhat might a scatterplot of data points look like if it were best described by a logarithmic model?arrow_forward
- How do you fit a linear regression model to data in R?arrow_forwardA cyclist is tracking weekly mileage while training for a race. The table models the number of miles, y, for a given week, x. Which type of model would best fit the data, and why?arrow_forwardUsing empirical data, a researcher developed a linear regression model of Ỹ = 65 + 0.9x1- 0.5x2 %3D to predict Y, the life span in years, where x, is the average hours per week of exercise and x2 is the number of years spent smoking. Using this model, what is the predicted life span for a person who exercised an average of 5 hours per week and smoked for 20 years? 50.5 years O 59.5 years 65 years 80.5 yearsarrow_forward
- The data in the chart below is for the distance (in cm) to the near point, the point nearest the eye at which the eye can accurately focus, at a person’s age. Use a spreadsheet application to create a linear regression model for the data in the form y = mx + b, where x is age and y is near point. Using your model, predict the near point of someone who is 86 years old. Round your answer to 1 decimal place. Age (years) Near Point (cm) 10 7.5 20 9 30 11.5 40 17.2 50 52.5 60 83.3arrow_forwardMultinomial logistic regression estimates how many sets of slope parameters? A. One, but with multiple intercept values B. One for every response level observed in the Dependent Variable C. One less than the number of response levels observed in the Dependent Variable D. None, multinomial logistic regression is non-parametricarrow_forwardDefine the three logarithmic regression models? Explain how Logarithms and percentages are inter linked?arrow_forward

 Glencoe Algebra 1, Student Edition, 9780079039897...AlgebraISBN:9780079039897Author:CarterPublisher:McGraw Hill
 Algebra & Trigonometry with Analytic GeometryAlgebraISBN:9781133382119Author:SwokowskiPublisher:Cengage