
Concept explainers
Videos
During a recent outbreak of Ebola in western Africa, the cumulative number of cases y was reported! months after April 1. (See Example 7)
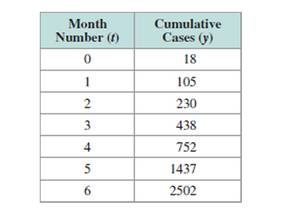
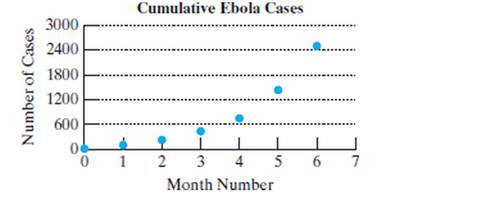
a. Use a graphing utility to find a model of the form
b. Write the function from part (a) as an exponential function of the form
c. Use either model to predict the number of Ebola cases 8 months after April 1 if this trend continues. Round to the nearest thousand.
d. Would it seem reasonable for this trend to continue indefinitely?
e. Use a graphing utility to find a logistic model
f. Use the logistic model from part (e) to predict the number of Ebola cases 8 months after April 1. Round to the nearest thousand.
Want to see the full answer?
Check out a sample textbook solution
Chapter 4 Solutions
360 11 WEEK COLLEGE ALGEBRA & TRIG


- Use a graphing calculator to solve each problem. In Example 4, suppose that a birth control program changed the formula for poulation growth to Pt=1000e0.01t. How long will the food supply be adequate? EXAMPLE 4 Using a Graphing Calculator to Solve a popuiation Problem Suppose that a country with a population of 1000 people is growing exponentially according to the population function Pt=1000e0.02t Where t in years. Furthermore, assume that the food supply, measured in adequate food per day per person, is growing linearly according to the function fx=30.625x+2000 In how many years will the population outstrip the food supply?arrow_forwardWhat is the y -intercept of the logistic growth model y=c1+aerx ? Show the steps for calculation. What does this point tell us about the population?arrow_forwardGrowth Rate Versus Weight Ecologists have studied how a populations intrinsic exponential growth rate r is related to the body weight W for herbivorous mammals. In table 5.2, W is the adult weight measured in pounds, and r is growth rate per year. Animal Weight W r Short-tailed vole 0.07 4.56 Norway rat 0.7 3.91 Rue deer 55 0.23 White-tailed deer 165 0.55 American elk 595 0.27 African elephant 8160 0.06 Find a formula that models r as a power function of W, and draw a graph of this function.arrow_forward
- You invest $500 at an annual interest rate of 5.25, compounded continuously. How long will it take your money to double? Compare your result with that of Example 10.arrow_forwardWhat role does the horizontal asymptote of anexponential function play in telling us about the endbehavior of the graph?arrow_forward
 Algebra & Trigonometry with Analytic GeometryAlgebraISBN:9781133382119Author:SwokowskiPublisher:Cengage
 Functions and Change: A Modeling Approach to Coll...AlgebraISBN:9781337111348Author:Bruce Crauder, Benny Evans, Alan NoellPublisher:Cengage Learning
 Big Ideas Math A Bridge To Success Algebra 1: Stu...AlgebraISBN:9781680331141Author:HOUGHTON MIFFLIN HARCOURTPublisher:Houghton Mifflin Harcourt
 College AlgebraAlgebraISBN:9781305115545Author:James Stewart, Lothar Redlin, Saleem WatsonPublisher:Cengage Learning
 Algebra and Trigonometry (MindTap Course List)AlgebraISBN:9781305071742Author:James Stewart, Lothar Redlin, Saleem WatsonPublisher:Cengage Learning