Basic Business Statistics, Student Value Edition (13th Edition)
13th Edition
ISBN: 9780321946393
Author: Mark L. Berenson, David M. Levine, Kathryn A. Szabat
Publisher: PEARSON
bartleby

Concept explainers

bartleby

Videos

Textbook Question
Book Icon
Chapter 5, Problem 1PS

Given the following probability distribution:

Chapter 5, Problem 1PS, Given the following probability distribution: a. Compute the <x-custom-btb-me data-me-id='2236' class='microExplainerHighlight'>expected value</x-custom-btb-me> for each distribution.

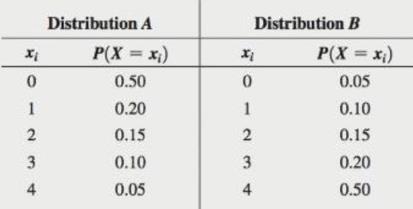
a. Compute the expected value for each distribution.

b. Compute the standard deviation for each distribution.

c. Compare the results of distribution A and B.

a.

Expert Solution
Check Mark
To determine

Find the expected value for distribution A and distribution B.

Answer to Problem 1PS

The expected value of distribution A is 1 and distribution B is 3.

Explanation of Solution

Calculation:

The table of probability distributions for distribution A and B is given.

The formula for calculating expected value is,

EX=i=1NxiPX=xi

Here, xi is the ith value of X , PX=xi is the probability of occurrence of the ith value of X , and N is the number of values in the discrete variable X .

The expected value of distribution A is calculated by substituting the values in the above formula. It is calculated as,

EX=0×0.50+1×0.20+2×0.15+3×0.10+4×0.05=0+0.20+0.30+0.30+0.20=1

The expected value of distribution B is,

EX=0×0.05+1×0.10+2×0.15+3×0.20+4×0.50=0+0.10+0.30+0.60+2=3

Thus, the expected value of distribution A and distribution B are 1 and 3, respectively.

b.

Expert Solution
Check Mark
To determine

Find the standard deviation of distribution A and B.

Answer to Problem 1PS

The standard deviation for both distributions A and B is 1.22474.

Explanation of Solution

Calculation:

The standard deviation is calculated using the formula,

σ=i=1NxiEX2PX=xi

Here, xi is the ith value of X , PX=xi is the probability of occurrence of the ith value of X , and N is the number of values in the discrete variable X .

For distribution A, EX=1 . So, the standard deviation for distribution A is calculated as,

σ=012×0.50+112×0.20+212×0.15+312×0.10+412×0.05=1.5=1.22474

For distribution B, EX=3 . So, the standard deviation for distribution B is calculated as,

σ=032×0.05+132×0.10+232×0.15+332×0.20+432×0.50=1.5=1.22474

Thus, the standard deviation of distribution A and B is same, that is, 1.2247.

c.

Expert Solution
Check Mark
To determine

Compare the results of the two distributions.

Answer to Problem 1PS

The mean value for distribution B is higher than distribution A but the standard deviation is same for both the distributions.

Explanation of Solution

From part a, the expected value for distribution A and B are obtained as 1 and 3, respectively. From part b, the standard deviation for both the distributions is obtained as 1.2247.

Thus, it can be said that the mean value or the expected value of distribution B is greater than that of distribution A. However, both of them have the same spread as the value of standard deviation is same.

Want to see more full solutions like this?

Subscribe now to access step-by-step solutions to millions of textbook problems written by subject matter experts!

Chapter 5 Solutions

Basic Business Statistics, Student Value Edition (13th Edition)

Ch. 5 - In the portfolio example in this section (see page...Ch. 5 - Prob. 12PSCh. 5 - Prob. 13PSCh. 5 - Prob. 14PSCh. 5 - Suppose that in Example 5.1 on page 193, you...Ch. 5 - Prob. 16PSCh. 5 - Suppose that in Problem 5.16 you wanted to create...Ch. 5 - Determine the following:...Ch. 5 - Prob. 19PSCh. 5 - Determine the mean and standard deviation of the...Ch. 5 - The increase or decrease in the price of a stock...Ch. 5 - Prob. 22PSCh. 5 - Prob. 23PSCh. 5 - A manufacturing company regularly conducts quality...Ch. 5 - When a customer places an order with Rudy’s...Ch. 5 - Prob. 26PSCh. 5 - In Example 5.5 on page 200, you and two friends...Ch. 5 - Assume a Poisson distribution....Ch. 5 - Assume a Poisson distribution....Ch. 5 - Assume a Poisson distribution with =5.0. What is...Ch. 5 - Prob. 31PSCh. 5 - The quality control manager of Marilyn’s Cookies...Ch. 5 - Refer to Problem 5.22. How many cookies in a batch...Ch. 5 - Prob. 34PSCh. 5 - Prob. 35PSCh. 5 - The Consumer Financial Protection Bureau’s...Ch. 5 - J.D. Power and Associates calculates and publishes...Ch. 5 - Prob. 38PSCh. 5 - Prob. 39PSCh. 5 - Refer to Problem 5.27. if you purchased a Toyota...Ch. 5 - A toll-free phone number is available from 9 A.M....Ch. 5 - Prob. 42PSCh. 5 - Prob. 43PSCh. 5 - An auditor for the Internal Revenue Service is...Ch. 5 - Prob. 45PSCh. 5 - Prob. 46PSCh. 5 - Prob. 47PSCh. 5 - Prob. 48PSCh. 5 - Prob. 49PSCh. 5 - What are the four properties that must be present...Ch. 5 - Prob. 51PSCh. 5 - Prob. 52PSCh. 5 - Darwin Head, a 35-year-old sawmill worker, won 1...Ch. 5 - Between 1896-when the Dow Jones index was...Ch. 5 - Smartphone adoption among American teens has...Ch. 5 - One theory concerning the Dow jones industrial...Ch. 5 - Prob. 57PSCh. 5 - Prob. 58PSCh. 5 - Social log-ins involve recommending of sharing an...Ch. 5 - The Consumer Financial Protection Bureau’s...Ch. 5 - Prob. 61PSCh. 5 - One theory concerning the...Ch. 5 - Spurious correlation refers to the apparent...Ch. 5 - Prob. 64PSCh. 5 - Prob. 65PS
Knowledge Booster
Background pattern image
Statistics
Learn more about
Need a deep-dive on the concept behind this application? Look no further. Learn more about this topic, statistics and related others by exploring similar questions and additional content below.
Recommended textbooks for you
Text book image
MATLAB: An Introduction with Applications
Statistics
ISBN:9781119256830
Author:Amos Gilat
Publisher:John Wiley & Sons Inc
Text book image
Probability and Statistics for Engineering and th...
Statistics
ISBN:9781305251809
Author:Jay L. Devore
Publisher:Cengage Learning
Text book image
Statistics for The Behavioral Sciences (MindTap C...
Statistics
ISBN:9781305504912
Author:Frederick J Gravetter, Larry B. Wallnau
Publisher:Cengage Learning
Text book image
Elementary Statistics: Picturing the World (7th E...
Statistics
ISBN:9780134683416
Author:Ron Larson, Betsy Farber
Publisher:PEARSON
Text book image
The Basic Practice of Statistics
Statistics
ISBN:9781319042578
Author:David S. Moore, William I. Notz, Michael A. Fligner
Publisher:W. H. Freeman
Text book image
Introduction to the Practice of Statistics
Statistics
ISBN:9781319013387
Author:David S. Moore, George P. McCabe, Bruce A. Craig
Publisher:W. H. Freeman
Continuous Probability Distributions - Basic Introduction; Author: The Organic Chemistry Tutor;https://www.youtube.com/watch?v=QxqxdQ_g2uw;License: Standard YouTube License, CC-BY
Probability Density Function (p.d.f.) Finding k (Part 1) | ExamSolutions; Author: ExamSolutions;https://www.youtube.com/watch?v=RsuS2ehsTDM;License: Standard YouTube License, CC-BY
Find the value of k so that the Function is a Probability Density Function; Author: The Math Sorcerer;https://www.youtube.com/watch?v=QqoCZWrVnbA;License: Standard Youtube License