
Concept explainers
The classification of soil based on United States department of agriculture textural classification chart.
Answer to Problem 5.1P
The classification of soil A as per the United States department of agriculture textural classification chart is
The classification of soil B as per the United States department of agriculture textural classification chart is
The classification of soil C as per the United States department of agriculture textural classification chart is
The classification of soil D as per the United States department of agriculture textural classification chart is
The classification of soil E as per the United States department of agriculture textural classification chart is
The classification of soil F as per the United States department of agriculture textural classification chart is
The classification of soil G as per the United States department of agriculture textural classification chart is
The classification of soil H as per the United States department of agriculture textural classification chart is
The classification of soil I as per the United States department of agriculture textural classification chart is
The classification of soil J as per the United States department of agriculture textural classification chart is
Explanation of Solution
Calculation:
Consider soil A:
Refer Figure (5.1) “U.S. Department of agriculture textural classification (USDA)”
in the text book.
Mark the percentage of sand for soil A as 20 %, percentage of silt as 20 %, and percentage of clay as 60 % in Figure (5.1) and mark the point of intersection of three lines.
Show the percentage of sand, silt, and clay of soil A as in Figure (1).
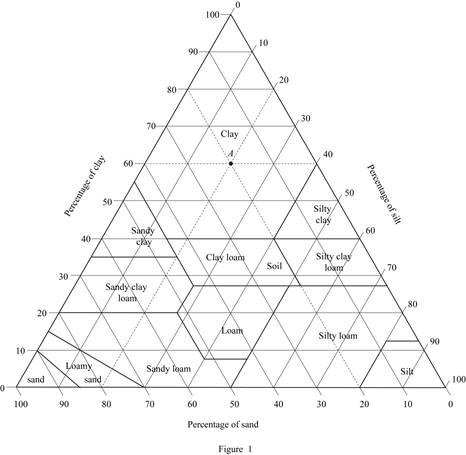
Refer Figure (1).
Hence, the classification of soil A as per the United States department of agriculture textural classification chart is
Consider soil B:
Mark the percentage of sand for soil B as 55 %, percentage of silt as 5 %, and percentage of clay as 40 % in Figure (5.1) and mark the point of intersection of three lines.
Show the percentage of sand, silt, and clay of soil B as in Figure (2).
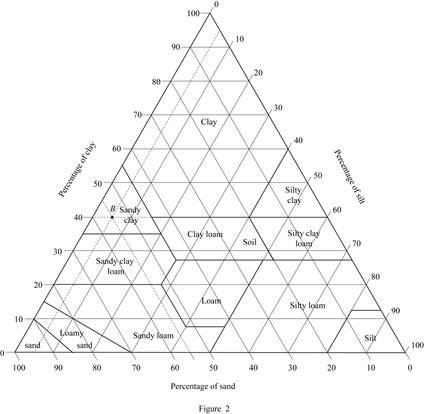
Refer Figure (2).
Thus, classification of soil B as per the United States department of agriculture textural classification chart is
Consider soil C:
Mark the percentage of sand for soil C as 45 %, percentage of silt as 35 %, and percentage of clay as 20 % in Figure (5.1) and mark the point of intersection of three lines.
Show the percentage of sand, silt, and clay of soil C as in Figure (3).
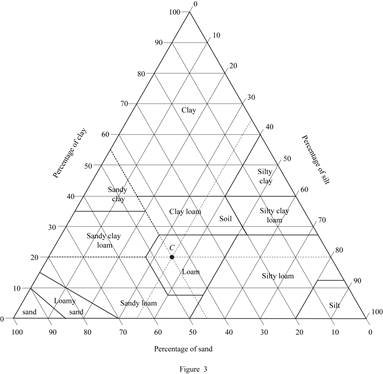
Refer Figure (3).
The classification of soil C as per the United States department of agriculture textural classification chart is
Consider soil D:
Mark the percentage of sand for soil D as 50 %, percentage of silt as 15 %, and percentage of clay as 35 % in Figure (5.1) and mark the point of intersection of three lines.
Show the percentage of sand, silt, and clay of soil D as in Figure (4).
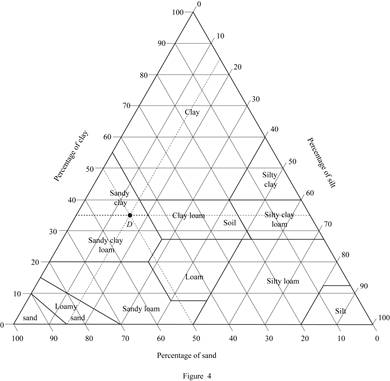
Refer Figure (4).
The classification of soil D as per the United States department of agriculture textural classification chart is
Consider soil E:
Mark the percentage of sand for soil E as 70 %, percentage of silt as 15 %, and percentage of clay as 15 % in Figure (5.1) and mark the point of intersection of three lines.
Show the percentage of sand, silt, and clay of soil E as in Figure (5).
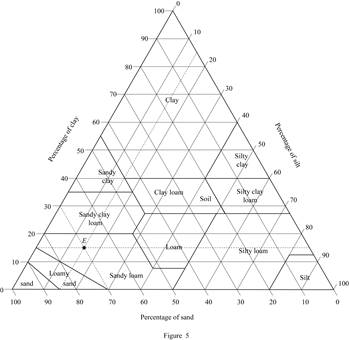
Refer Figure (5).
The classification of soil E as per the United States department of agriculture textural classification chart is
Consider soil F:
Refer Figure (5.1) “U.S. Department of agriculture textural classification (USDA)”
in the text book.
Mark the percentage of sand for soil F as 30 %, percentage of silt as 58 %, and percentage of clay as 12 % in Figure (5.1) and mark the point of intersection of three lines.
Show the percentage of sand, silt, and clay of soil F as in Figure (6).
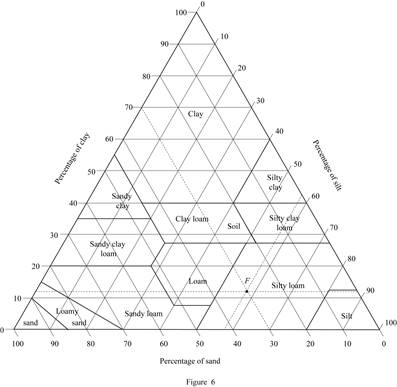
Refer Figure (6).
Hence, the classification of soil F as per the United States department of agriculture textural classification chart is
Consider soil G:
Mark the percentage of sand for soil G as 40 %, percentage of silt as 25 %, and percentage of clay as 35 % in Figure (5.1) and mark the point of intersection of three lines.
Show the percentage of sand, silt, and clay of soil G as in Figure (7).
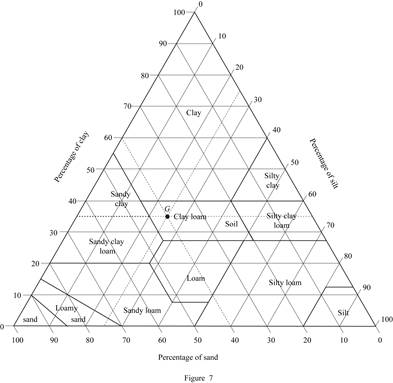
Refer Figure (7).
Thus, classification of soil G as per the United States department of agriculture textural classification chart is
Consider soil H:
Mark the percentage of sand for soil H as 30 %, percentage of silt as 25 %, and percentage of clay as 45 % in Figure (5.1) and mark the point of intersection of three lines.
Show the percentage of sand, silt, and clay of soil H as in Figure (8).
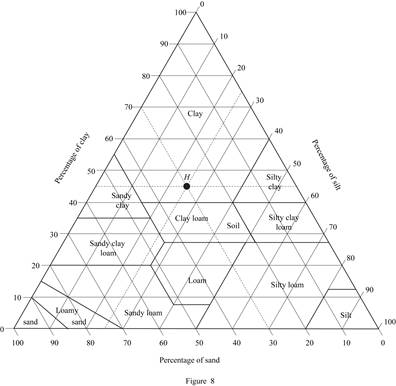
Refer Figure (8).
The classification of soil H as per the United States department of agriculture textural classification chart is
Consider soil I:
Mark the percentage of sand for soil I as 5 %, percentage of silt as 45 %, and percentage of clay as 50 % in Figure (5.1) and mark the point of intersection of three lines.
Show the percentage of sand, silt, and clay of soil I as in Figure (9).
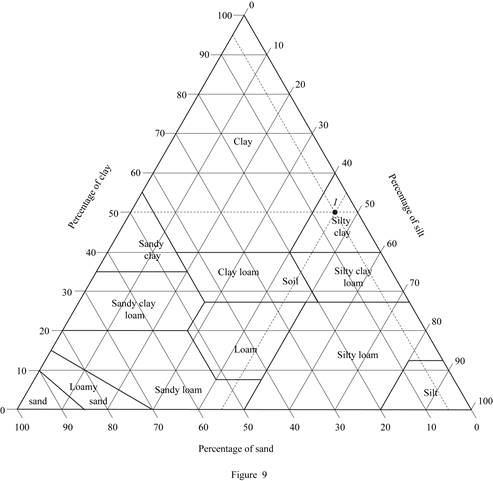
Refer Figure (9).
The classification of soil I as per the United States department of agriculture textural classification chart is
Consider soil J:
Mark the percentage of sand for soil J as 45 %, percentage of silt as 45 %, and percentage of clay as 10 % in Figure (5.1) and mark the point of intersection of three lines.
Show the percentage of sand, silt, and clay of soil J as in Figure (10).
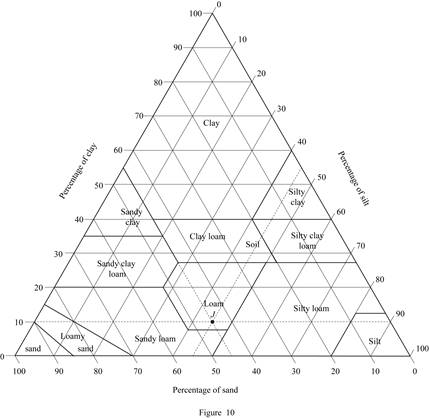
Refer Figure (10).
The classification of soil J as per the United States department of agriculture textural classification chart is
Want to see more full solutions like this?
Chapter 5 Solutions
Principles of Geotechnical Engineering (MindTap Course List)


- Classify all the soils in 5.8 using unified soil classification system. Give group symbols and the group namesarrow_forwardFor the data below, classify the soils according to USCSarrow_forward. Classify the following inorganic soils by using the Unified Soil Classification System. Give the Group Symbols, but it is not necessary to go beyond that to the group name.arrow_forward
- Determine : 1. Soil classification of soil A using AASHTO method. 2. Soil classification of soil B using USCS method. 3. Soil classification of soil C using USDA method.arrow_forwardFrom the following soils classify according to AASHTO and SUCS systemsarrow_forwardWrite note on Granular soils.arrow_forward
- Given soil having particle size distribution of 8% sand, 20% gravel, 48% sit and 24% clay, classify the soll using Textural Classification System/USDAarrow_forwardDescribe some basic terms related to soil consumption.arrow_forwardClassify the soil sample using the U.S. Department of Agriculture textural classification chart. Sand =60 Silt = 35 Clay = 70.arrow_forward

 Structural Analysis (10th Edition)Civil EngineeringISBN:9780134610672Author:Russell C. HibbelerPublisher:PEARSON
 Principles of Foundation Engineering (MindTap Cou...Civil EngineeringISBN:9781337705028Author:Braja M. Das, Nagaratnam SivakuganPublisher:Cengage Learning
 Fundamentals of Structural AnalysisCivil EngineeringISBN:9780073398006Author:Kenneth M. Leet Emeritus, Chia-Ming Uang, Joel LanningPublisher:McGraw-Hill Education
 Traffic and Highway EngineeringCivil EngineeringISBN:9781305156241Author:Garber, Nicholas J.Publisher:Cengage Learning