To find:
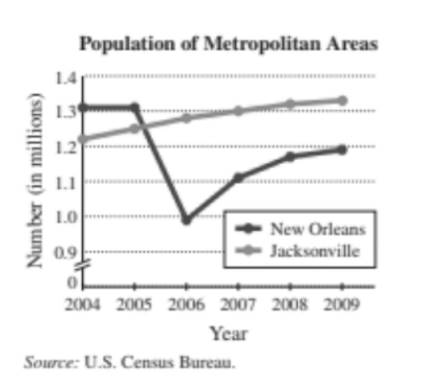
What year the population of the Jacksonville metropolitan area greater than that of the New Orleans metropolitan area.
Answer to Problem 1E
Solution:
In year
Explanation of Solution
Procedure:
A graph is a visual way to display data. A line graph is used to show how data changes over a period of time.
Given:
Many factors may contribute to population changes in metropolitan areas. The graphs shows the populations of the New Orleans, Louisiana, and the Jacksonville, Florida, metropolitan areas over the years
Calculation:
By the given graph,
The population of the Jacksonville metropolitan area greater than that of the New Orleans metropolitan area in the years from
Final statement:
In
Want to see more full solutions like this?
Chapter 5 Solutions
Essentials Of College Algebra With Integrated Review, Books A La Carte Edition, Plus Mylab Math Student Access Card And Worksheets

 Algebra and Trigonometry (6th Edition)AlgebraISBN:9780134463216Author:Robert F. BlitzerPublisher:PEARSON
 Contemporary Abstract AlgebraAlgebraISBN:9781305657960Author:Joseph GallianPublisher:Cengage Learning
 Linear Algebra: A Modern IntroductionAlgebraISBN:9781285463247Author:David PoolePublisher:Cengage Learning
 Algebra And Trigonometry (11th Edition)AlgebraISBN:9780135163078Author:Michael SullivanPublisher:PEARSON
 Introduction to Linear Algebra, Fifth EditionAlgebraISBN:9780980232776Author:Gilbert StrangPublisher:Wellesley-Cambridge Press
 College Algebra (Collegiate Math)AlgebraISBN:9780077836344Author:Julie Miller, Donna GerkenPublisher:McGraw-Hill Education