Concept explainers
Videos
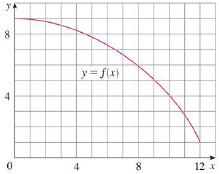
(a) Use six rectangles to find estimates of each type for the area under the given graph of f from x = 0 to x = 12.
(i) L6 (sample points are left endpoints)
(ii) R6 (sample points are right endpoints)
(iii) M6 (sample points are midpoints)
(b) Is L6 an underestimate or overestimate of the true area?
(c) Is R6 an underestimate or overestimate of the true area?
(d) Which of the numbers L6, R6, or M6 gives the best estimate? Explain.

Trending nowThis is a popular solution!

Chapter 5 Solutions
Single Variable Calculus: Early Transcendentals, Volume I
Additional Math Textbook Solutions
Calculus Early Transcendentals, Binder Ready Version
Calculus & Its Applications (14th Edition)
Advanced Mathematical Concepts: Precalculus with Applications, Student Edition
Precalculus
Glencoe Math Accelerated, Student Edition
Thomas' Calculus: Early Transcendentals (14th Edition)


- A Troublesome Snowball One winter afternoon, unbeknownst to his mom, a child bring a snowball into the house, lays it on the floor, and then goes to watch T.V. Let W=W(t) be the volume of dirty water that has soaked into the carpet t minutes after the snowball was deposited on the floor. Explain in practical terms what the limiting value of W represents, and tell what has happened physically when this limiting value is reached.arrow_forwardSuppose that the average cost, in dollars, of producing a shipment of a certain product is C = 3,000x + 12,000/x , x > 0 where x is the number of machines used in the production process. (a) Find the critical values of this function. (Assume 0 < x < ∞. Enter your answers as a comma-separated list.) x = (b) Over what interval does the average cost decrease? (Enter your answer using interval notation.) (c) Over what interval does the average cost increase? (Enter your answer using interval notation.)arrow_forward(a) Use six rectangles to find estimates of each type for thearea under the given graph of f from x =0 to x=12 .(i) L6(sample points are left endpoints)(ii) R6(sample points are right endpoints)(iii)M6 (sample points are midpoints)(b) Is L6 an underestimate or overestimate of the true area?(c) Is R6 an underestimate or overestimate of the true area? (d) Which of the numbers L6 ,R6 , or M6 gives the best estimate?Explain.arrow_forward
- Part 1.Find the dimensions of the rectangular box having the largest volume and surface area 24 square units. List the dimensions in ascending order ( , , ) Part 2.Locate all the critical points of the function f(x,y)=10x−x2−5xy2.arrow_forward(a) By reading values from the given graph of f, use five rectangles to find a lower estimate and an upper estimate for the area under the given graph of f from x=0 to x=10 . in each case sketch the rectangles that you use. (b) Find new estimates using ten rectangles in each case.arrow_forward4. Analyze and sketch: x- and y-intercepts Critical Numbers Table for increase/decrease + local extrema Sketcharrow_forward
- The region between the graph of y = x2 and the x-axis for O < x < 2arrow_forwardUse a graph below of f(x) = ln (3x^2 +1) to estimate the x-values of any critical points and inflection points of f(x).arrow_forwardIf a company's marginal revenue function is MR(x) = xe−x/9, find the revenue function. [Hint: Evaluate the constant C so that revenue is 0 at x = 0.] R(x)=arrow_forward
 Algebra & Trigonometry with Analytic GeometryAlgebraISBN:9781133382119Author:SwokowskiPublisher:Cengage
 Functions and Change: A Modeling Approach to Coll...AlgebraISBN:9781337111348Author:Bruce Crauder, Benny Evans, Alan NoellPublisher:Cengage Learning
 Big Ideas Math A Bridge To Success Algebra 1: Stu...AlgebraISBN:9781680331141Author:HOUGHTON MIFFLIN HARCOURTPublisher:Houghton Mifflin Harcourt
 Trigonometry (MindTap Course List)TrigonometryISBN:9781337278461Author:Ron LarsonPublisher:Cengage Learning