Uniform Distribution A uniform distribution is a continuous probability distribution for a random variable x between two values a and b ( a < b ) , where a ≤ x ≤ b and alt of the values of x are equally likely to occur. The graph of a uniform distribution is shown below. The probability density function of a uniform distribution is y = 1 b − a on the interval from x = a to x = b. For any value of x less than a or greater than b, y = 0. In Exercises 59 and 60, use this information. 60. For two values c and d. where a ≤ c < d ≤ b, the probability that x lies between c and d is equal to the area under the curve between c and d. as shown below. So, the area of the red region equals the probability that x lies between c and d. For a uniform distribution from a = 1 to b = 25, find the probability that (a) x lies between 2 and 8. (b) x lies between 4 and 12. (c) x lies between 5 and 17. (d) x lies between 8 and 14.
Uniform Distribution A uniform distribution is a continuous probability distribution for a random variable x between two values a and b ( a < b ) , where a ≤ x ≤ b and alt of the values of x are equally likely to occur. The graph of a uniform distribution is shown below. The probability density function of a uniform distribution is y = 1 b − a on the interval from x = a to x = b. For any value of x less than a or greater than b, y = 0. In Exercises 59 and 60, use this information. 60. For two values c and d. where a ≤ c < d ≤ b, the probability that x lies between c and d is equal to the area under the curve between c and d. as shown below. So, the area of the red region equals the probability that x lies between c and d. For a uniform distribution from a = 1 to b = 25, find the probability that (a) x lies between 2 and 8. (b) x lies between 4 and 12. (c) x lies between 5 and 17. (d) x lies between 8 and 14.
Solution Summary: The author explains that the probability of x lies between 2 and 8 is 0.25, and the required probability is obtained by finding the area of the red region.
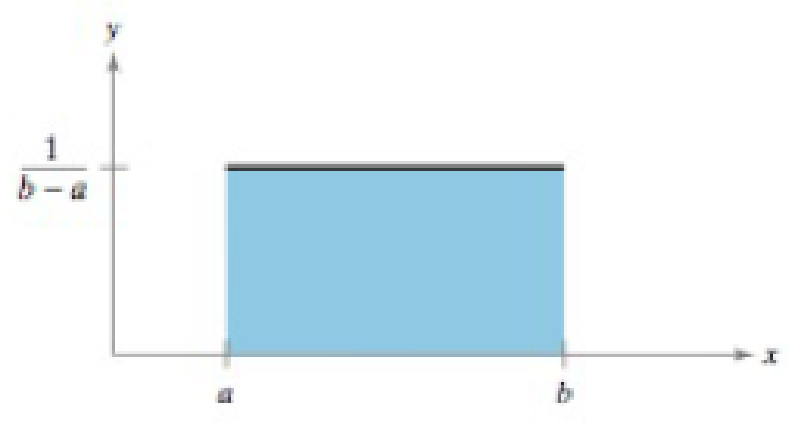
Uniform DistributionA uniform distribution is a continuous probability distribution for a random variable x between two values a and b (a < b), where a ≤ x ≤ b and alt of the values of x are equally likely to occur. The graph of a uniform distribution is shown below.
The probability density function of a uniform distribution is
y
=
1
b
−
a
on the interval from x = a to x = b. For any value of x less than a or greater than b, y = 0. In Exercises 59 and 60, use this information.
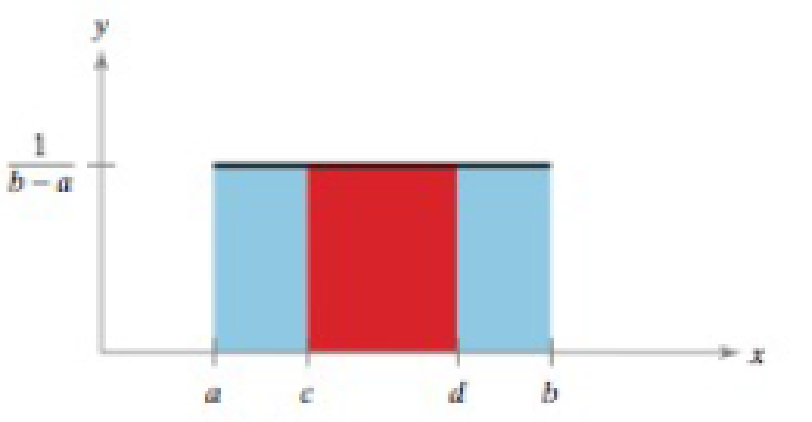
60. For two values c and d. where a ≤ c < d ≤ b, the probability that x lies between c and d is equal to the area under the curve between c and d. as shown below.
So, the area of the red region equals the probability that x lies between c and d. For a uniform distribution from a = 1 to b = 25, find the probability that
Need a deep-dive on the concept behind this application? Look no further. Learn more about this topic, statistics and related others by exploring similar questions and additional content below.
Continuous Probability Distributions - Basic Introduction; Author: The Organic Chemistry Tutor;https://www.youtube.com/watch?v=QxqxdQ_g2uw;License: Standard YouTube License, CC-BY
Probability Density Function (p.d.f.) Finding k (Part 1) | ExamSolutions; Author: ExamSolutions;https://www.youtube.com/watch?v=RsuS2ehsTDM;License: Standard YouTube License, CC-BY
Find the value of k so that the Function is a Probability Density Function; Author: The Math Sorcerer;https://www.youtube.com/watch?v=QqoCZWrVnbA;License: Standard Youtube License


 Functions and Change: A Modeling Approach to Coll...AlgebraISBN:9781337111348Author:Bruce Crauder, Benny Evans, Alan NoellPublisher:Cengage Learning
 Trigonometry (MindTap Course List)TrigonometryISBN:9781337278461Author:Ron LarsonPublisher:Cengage Learning