Concept explainers
Videos
Family Library The Venn diagram in Fig. 10 classifies the 100 books in a family’s library as hardback
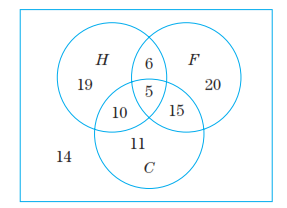
Figure 10
How many books are paperback fiction?
Want to see the full answer?
Check out a sample textbook solution
Chapter 5 Solutions
EBK FINITE MATHEMATICS & ITS APPLICATIO
Additional Math Textbook Solutions
Mathematics for the Trades: A Guided Approach (10th Edition) - Standalone book
Excursions in Modern Mathematics (9th Edition)
A Problem Solving Approach To Mathematics For Elementary School Teachers (13th Edition)
Finite Mathematics for Business, Economics, Life Sciences and Social Sciences Plus NEW MyLab Math with Pearson eText -- Access Card Package (13th Edition)
Mathematics for Elementary Teachers with Activities (5th Edition)
Discrete Mathematics and Its Applications ( 8th International Edition ) ISBN:9781260091991


- Below are four bivariate data sets and their scatter plots. (Note that all of the scatter plots are displayed with the same scale.) Each data set is made up of sample values drawn from a population. U V 11- x y 1.0 4.1 10+ 1.0 7.9 11 10+ 9+ 2.0 6.5 9+ 8- 2.0 6.7 3.0 7.5 8- 3.0 8.1 7- 7+ 6- 4.0 9.6 6- 4.0 5.9 5. 5.0 9.6 5.0 6.7 6.0 10.1 3- 6.0 4.6 7.0 5.2 2- 7.0 9.5 2- 1- 8.0 8.1 8.0 3.7 0 8 0 9 10 9.0 6.1 9.0 4.6 8 9 10 11 10.0 3.9 Figure 1 10.0 3.2 Figure 2 W t m n 11 1.0 10.0 1.0 3.9 11 10- 10+ X 9+ 2.0 9.0 2.0 6.4 9. 8+ 8+ 3.0 7.0 7- 7- 3.0 8.0 4.0 7.0 6+ 4.0 4.6 6+ 5- 5.0 6.0 5.0 5.0 4- 6.0 5.0 3+ 3- 6.0 7.8 7.05.2 7.0 4.0 2- 1+ 1- 8.0 3.0 8.0 6.8 0 0 9.0 2.0 9.0 8.5 10.0 1.0 Figure 3 10.0 7.6 Figure 4 Answer the following questions. The same response may be the correct answer for more than one question. (a) Which data set indicates a perfect positive linear relationship between its two variables? X ? (Choose one) (b) Which data set has an apparent positive, but not perfect, linear…arrow_forwardPart 3: Create a visual of your model- Use what you found in parts 1 and 2. Use smiley face stickers for the 30 people and the 100 gold star stickers for the wealth. Asia North America Europe North America South America Europe Africa Oceania Antarctica South America Africa Oceania 57 52arrow_forwardGive two examples ofdata collecting from day -to -day life.arrow_forward
- Section E plsarrow_forwardOf the 360 students in the freshman class, 216 are on the honor roll and 180 play a school sport. Of those that play a school sport, 112 are not on the honor roll. Complete the Venn diagram below to represent this situation. Freshman School Honor Roll Sport P(school sport| honor roll) 50.5% 45.9% 48.1% 31.5%arrow_forwardch 15 end. 2: Last rating period, the percentages of viewers watching several channels between 11 p.m. and 11:30 p.m. in a major TV market were as follows:arrow_forward
- Use the first table to answer the question? Parts a,b,c and darrow_forwardMs. Sampson recorded the percentage change in her students quarter grades after entering the scores from the students' topic tests. Which student's change would be represented by the point farthest from 0 on a number line? Student Change in Quarter Grade Andre 3.76 Brenna 5.48 Christopher -6.15 Delfina -3.33 A. Andre Brenna C. Christopher D. Delfina Review progress Question 5 lof 5 B.arrow_forwardSection 2.2, question 3arrow_forward
- illustrate the hand-shaking theorem?arrow_forwardSolve AABC subject to the given conditions. Round the lengths of the sides and measures of the angles (in degrees) to 1 decimal place if necessary. b = 17/ c = 22 B a = 28 Part: 0 / 3 Part 1 of 3 Part: 1/ 3 Part 2 of 3arrow_forward1 5 6 7 8 9 10 11 12 13 14 15 16 17 18 19 20 data Q Based on the boxplot above, identify the 5 number summaryarrow_forward
 Holt Mcdougal Larson Pre-algebra: Student Edition...AlgebraISBN:9780547587776Author:HOLT MCDOUGALPublisher:HOLT MCDOUGAL
 Glencoe Algebra 1, Student Edition, 9780079039897...AlgebraISBN:9780079039897Author:CarterPublisher:McGraw Hill
 Algebra: Structure And Method, Book 1AlgebraISBN:9780395977224Author:Richard G. Brown, Mary P. Dolciani, Robert H. Sorgenfrey, William L. ColePublisher:McDougal Littell