Problems 51–58 refer to the following slope fields: Figure for 51–58 57. Use a graphing calculator to graph y = 1 – Ce − x for C = −2, −1, 1, and 2, for − 5 ≤ x ≤ 5, −5 ≤ y ≤ 5, all in the same viewing window. Observe how the solution curves go with the flow of the tangent line segments in the corresponding slope field shown in Figure A or Figure B.
Problems 51–58 refer to the following slope fields: Figure for 51–58 57. Use a graphing calculator to graph y = 1 – Ce − x for C = −2, −1, 1, and 2, for − 5 ≤ x ≤ 5, −5 ≤ y ≤ 5, all in the same viewing window. Observe how the solution curves go with the flow of the tangent line segments in the corresponding slope field shown in Figure A or Figure B.
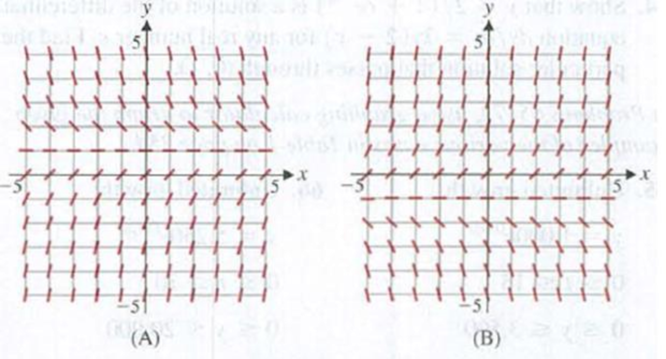
Solution Summary: The author explains how to draw the graph of the general solution of y=1-Ce-x for the differential equation for C=-2,1 and 2
Problems 51–58 refer to the following slope fields:
Figure for 51–58
57. Use a graphing calculator to graph y = 1 – Ce−x for C = −2, −1, 1, and 2, for − 5 ≤ x ≤ 5, −5 ≤ y ≤ 5, all in the same viewing window. Observe how the solution curves go with the flow of the tangent line segments in the corresponding slope field shown in Figure A or Figure B.
In Figure 1.6, suppose another Y observation is obtained at X = 45. Would E{Y} for this newobservation still be 104? Would the Y value for this new case again be 108?
ANSWER #3 ONLY
Transistor gain is an integrated circuit device between emitter and collector (hFE) is related to twovariables, that can be controlled at the deposition process, emitter drive-in time (x1, in minutes), andemitter dose (x2, in ions x 1014). Fourteen samples were observed following deposition. The table shows the data.
1. Determine if emitter drive-in influences gain in a linear relationship. Test H0: β1=0, where β1 is the slope of the regressor variable.2. Determine if emitter dose influences gain in a linear relationship. Which regressor variable is thebest predictor of gain?3. Graph the scatter plot of the two regressor variables in separate graphs and draw the regressionline. Compare both graphs in terms on the results of a. and b.
Suppose A is changed to A' .How large a relative change can this change produce in the solution to Ax = b?
Mathematics with Applications In the Management, Natural, and Social Sciences (12th Edition)
Knowledge Booster
Learn more about
Need a deep-dive on the concept behind this application? Look no further. Learn more about this topic, subject and related others by exploring similar questions and additional content below.

 57. Use a graphing calculator to graph y = 1 – Ce−x for C = −2, −1, 1, and 2, for − 5 ≤ x ≤ 5, −5 ≤ y ≤ 5, all in the same viewing window. Observe how the solution curves go with the flow of the tangent line segments in the corresponding slope field shown in Figure A or Figure B.


 Discrete Mathematics and Its Applications ( 8th I...MathISBN:9781259676512Author:Kenneth H RosenPublisher:McGraw-Hill Education
 Mathematics for Elementary Teachers with Activiti...MathISBN:9780134392790Author:Beckmann, SybillaPublisher:PEARSON
 Thinking Mathematically (7th Edition)MathISBN:9780134683713Author:Robert F. BlitzerPublisher:PEARSON
 Discrete Mathematics With ApplicationsMathISBN:9781337694193Author:EPP, Susanna S.Publisher:Cengage Learning,
 Pathways To Math Literacy (looseleaf)MathISBN:9781259985607Author:David Sobecki Professor, Brian A. MercerPublisher:McGraw-Hill Education