
Concept explainers
Videos
Scientific Research: 1983–2003 The percentage of research articles in the prominent journal Physical Review that were written by researchers in the United States during 1983–2003 can be modeled by
Where t is time in years since 1983. The graphs of
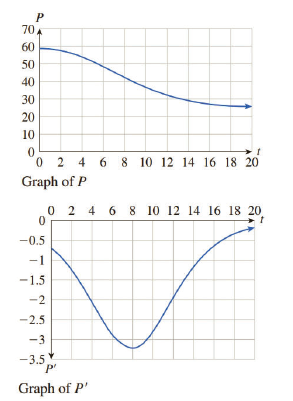
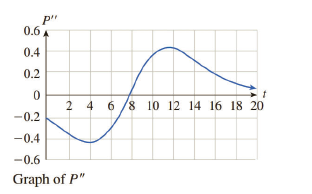
Determine, to the nearest whole number, the values of t for which the graph of P is concave up and where it is concave down, and locate any points of inflection. What does the point of inflection tell you about science articles? [HINT: See Example 4.]
Want to see the full answer?
Check out a sample textbook solution
Chapter 5 Solutions
Applied Calculus, Loose-leaf Version


- 1.9 Write the equation that results in the desired transformation: The graph of y = x³, vertically compressed by a factor of 0.8. y = 0.8 a. b. y = (x – 0.8)³ С. y = (x + 0.8)³ d. y = 0.8x³arrow_forwardQuestion 20arrow_forward10 – 11. Margaret, an archeologist, is conducting a test to determine if there is a positive linear relationship between the total height of a dinosaur and its leg length. Her random sample of 15 dinosaur total heights (in feet) and leg lengths (in feet) produced the results shown in the following TI calculator screen. Use the TI calculations in the screen shot to help you answer questions: 10 & 11. LinReg y=a+bx a=28.67845743 b=5.639892354 r=559696513 r=.7481286741 10. What would you predict for a dinosaur's total height (to 2 decimal places) in feet, if the leg length is 5.8 feet? a) 61.39 feet b) 28.68 feet c) 114.99 feet d) 61.33 feet e) 74.81 feet 11. What percent of variation in the dinosaur's total height can be accounted for by the variation in the dinosaur's leg length? a) 28.68% b) 5.64%% c) 55.97% d) 74.81% e) none of thesearrow_forward
- Sections 2.6 1. Solve for x: log, x = -log, 4+-log, 16-2 log, 3 2. %3D 2. 2. Solve for x: log,(x-4)+log, x= log, 12arrow_forwardQuestion 20 The temperatures of component A and component B in a heat exchanger vary in a linear fashion as shown in the graph below, where y is the temperature in °C, after x minutes. 72 (b) -20- 10 24 (a) Determine a rule for the temperature of component A in terms of x. Showing full working, determine when both components are at the same temperature, and state what this temperature is.arrow_forwardFigure a. shows world population, in billions, for seven selected years from 1950 through 2010. A scatter plot is shown in Figure b. Suggest two types of functions that would be good choices for modeling the data.arrow_forward
 Algebra & Trigonometry with Analytic GeometryAlgebraISBN:9781133382119Author:SwokowskiPublisher:Cengage