
a.
To graph: The equation
Given information:
The equation:
Graph:
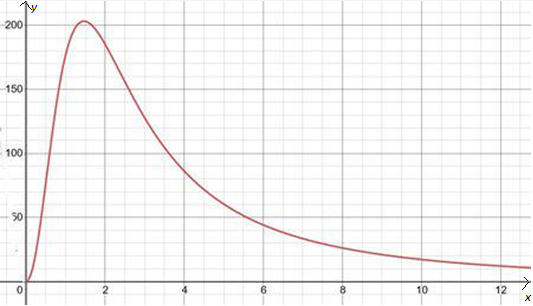
Interpretation:
Obtained a graph of equation:
b.
To calculate: A second dose of the drug is taken
Equation to model the amount of the second dose in the bloodstream is:
Given information:
The equation:
Concept used:
Algebraically simplifying the equation
Calculation:
Since
It means that the dose was taken at the moment
The amount
The second dose is taken one hour after the first one, it follows that if
The amount of the aspirin from the second dose in the bloodstream after
Since the second dose is just added to the amount of aspirin already circulating from the first dose,
Add these two amounts together. Hence, the formula is;
Conclusion:
c.
To graph: A model for the total amount of aspirin in the bloodstream after the second dose is taken.
Given information:
The equation:
Graph:
Let,
Total:
Graph of the total
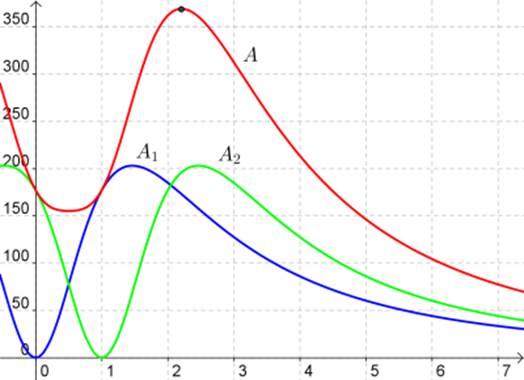
Interpretation:
d.
To graph: Model About how long after the second dose has been taken is the greatest amount of aspirin in the bloodstream.
Given information:
The equation:
Graph:
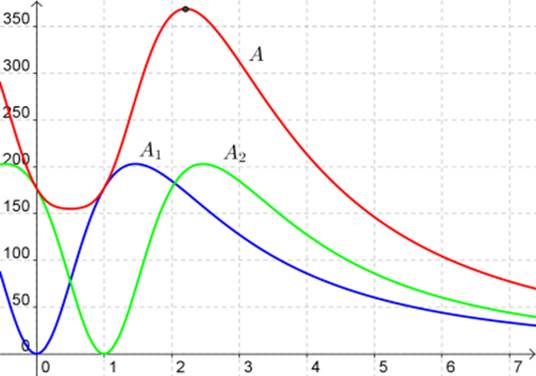
Interpretation:
The maximum of
Chapter 5 Solutions
Holt Mcdougal Larson Algebra 2: Student Edition 2012

 Algebra and Trigonometry (6th Edition)AlgebraISBN:9780134463216Author:Robert F. BlitzerPublisher:PEARSON
 Contemporary Abstract AlgebraAlgebraISBN:9781305657960Author:Joseph GallianPublisher:Cengage Learning
 Linear Algebra: A Modern IntroductionAlgebraISBN:9781285463247Author:David PoolePublisher:Cengage Learning
 Algebra And Trigonometry (11th Edition)AlgebraISBN:9780135163078Author:Michael SullivanPublisher:PEARSON
 Introduction to Linear Algebra, Fifth EditionAlgebraISBN:9780980232776Author:Gilbert StrangPublisher:Wellesley-Cambridge Press
 College Algebra (Collegiate Math)AlgebraISBN:9780077836344Author:Julie Miller, Donna GerkenPublisher:McGraw-Hill Education