
Videos
Application Exercises
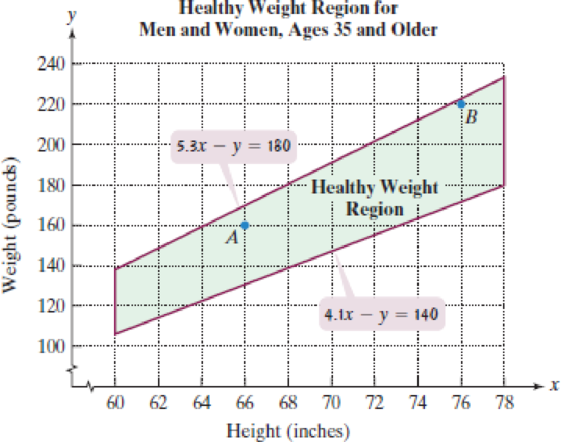
The figure shows the healthy weight region for various heights for people ages 35 and older.
Source: U.S. Department of Health and Human Services
If x represents height, in inches, and y represents weight, in pounds, the healthy weight region can be modeled by the following system of linear inequalities:
Use this information to solve Exercises 77–80.
78. Show that point B is a solution of the system of inequalities that describes healthy weight for this age group.
Want to see the full answer?
Check out a sample textbook solution
Chapter 5 Solutions
EBK COLLEGE ALGEBRA ESSENTIALS


- For Exercises 9–10, determine if the equation is linear or nonlinear. If the equation is linear, find the solution set. −2x = 8arrow_forwardIn Exercises 61–64, find an equation for the level surface of the function through the given point.arrow_forwardIn Exercises 11–12, find the solution set for each equation. 11. |5x + 3| = 7 12. |6x + 1| = [4x + 15||arrow_forward
- U.S. Population The number of White non-Hispanicindividuals in the U.S. civilian non-institutional population 16 years and older was 153.1 million in 2000and is projected to be 169.4 million in 2050.(Source: U.S. Census Bureau)a. Find the average annual rate of change in population during the period 2000–2050, with the appropriate units.b. Use the slope from part (a) and the population in2000 to write the equation of the line associatedwith 2000 and 2050.c. What does this model project the population to bein 2020?arrow_forwardWorld Military Expenditure The following chart shows total military and arms trade expenditure from 2011–2020 (t = 1 represents 2011). †A bar graph titled "World military expenditure" has a horizontal t-axis labeled "Year since 2010" and a vertical axis labeled "$ (billions)". The bar graph has 10 bars. Each bar is associated with a label and an approximate value as listed below. 1: 1,800 billion dollars 2: 1,775 billion dollars 3: 1,750 billion dollars 4: 1,730 billion dollars 5: 1,760 billion dollars 6: 1,760 billion dollars 7: 1,850 billion dollars 8: 1,900 billion dollars 9: 1,950 billion dollars 10: 1,980 billion dollars (a) If you want to model the expenditure figures with a function of the form f(t) = at2 + bt + c, would you expect the coefficient a to be positive or negative? Why? HINT [See "Features of a Parabola" in this section.] We would expect the coefficient to be positive because the curve is concave up. We would expect the coefficient to be negative because the…arrow_forwardExercises 93–94: Energy The following graph shows U.S. Energy consumption. 400 350 300 250 200 150 100 50 04 1970 1990 2010 Year 93. When was energy consumption increasing? 94. When was energy consumption decreasing? Energy (millions of Btu)arrow_forward
- Q6 MCQ . GDP does not directly include: the value of goods produced domestically and sold abroad. the value of intermediate goods sold during a period. the value of services rendered during a period. the value of final goods and services produced, but not sold, during a period.arrow_forwardPractice PLUS Exercises 65–68 describe quadratic equations. Match each description with the graph of the corresponding quadratic function. Each graph is shown in a [-10, 10, 1] by [–10, 10, 1] viewing rectangle. 65. A quadratic equation whose solution set contains imaginary numbers 66. A quadratic equation whose discriminant is 0 67. A quadratic equation whose solution set is {3 ± V2} 68. A quadratic equation whose solution set contains integers а. b. C. d. 69. When the sum of 6 and twice a positive number is subtracted from the square of the number, 0 results. Find the number. 70. When the sum of 1 and twice a negative number isarrow_forwardIn Exercises 65–68, find and sketch the domain of ƒ. Then find an equation for the level curve or surface of the function passing through the given point.arrow_forward
 Algebra & Trigonometry with Analytic GeometryAlgebraISBN:9781133382119Author:SwokowskiPublisher:Cengage