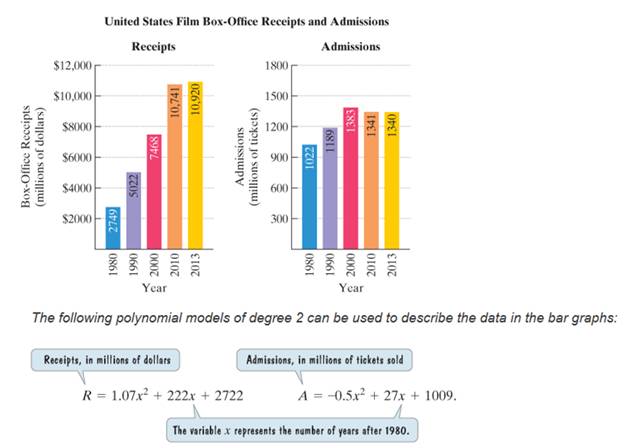
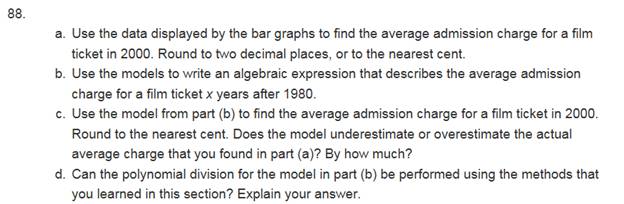
The bar graphs show U. S. film box-office receipts, in millions of dollars, and box-office admissions, in millions of tickets sold, for five selected years. Use the information and a calculator to solve exercises 87-88. 88. a. Use the data displayed by the bar graphs to find the average admission charge for a film ticket in 2000. Round to two decimal places, or to the nearest cent. b. Use the models to write an algebraic expression that describes the average admission charge for a film ticket x years after 1980. c. Use the model from part (b) to find the average admission charge for a film ticket in 2000. Round to the nearest cent. Does the model underestimate or overestimate the actual average charge that you found in part (a)? By how much? d. Can the polynomial division for the model in part (b) be performed using the methods that you learned in this section? Explain your answer.
The bar graphs show U. S. film box-office receipts, in millions of dollars, and box-office admissions, in millions of tickets sold, for five selected years. Use the information and a calculator to solve exercises 87-88. 88. a. Use the data displayed by the bar graphs to find the average admission charge for a film ticket in 2000. Round to two decimal places, or to the nearest cent. b. Use the models to write an algebraic expression that describes the average admission charge for a film ticket x years after 1980. c. Use the model from part (b) to find the average admission charge for a film ticket in 2000. Round to the nearest cent. Does the model underestimate or overestimate the actual average charge that you found in part (a)? By how much? d. Can the polynomial division for the model in part (b) be performed using the methods that you learned in this section? Explain your answer.
Solution Summary: The author explains how the average admission charge for a film ticket in 2000 was determined to be 5.40.
The bar graphs show U. S. film box-office receipts, in millions of dollars, and box-office admissions, in millions of tickets sold, for five selected years. Use the information and a calculator to solve exercises 87-88.
88. a. Use the data displayed by the bar graphs to find the average admission charge for a film ticket in 2000. Round to two decimal places, or to the nearest cent. b. Use the models to write an algebraic expression that describes the average admission charge for a film ticket x years after 1980. c. Use the model from part (b) to find the average admission charge for a film ticket in 2000. Round to the nearest cent. Does the model underestimate or overestimate the actual average charge that you found in part (a)? By how much? d. Can the polynomial division for the model in part (b) be performed using the methods that you learned in this section? Explain your answer.
How will you spend your average life expectancy of 78 years?The bar graph shows the average number of years you will devote to each of your most time-consuming activities.According to the American Bureau of Labor Statistics, you will devote 37 years to sleeping and watching TV. The numberof years sleeping will exceed the number of years watching TV by 19. Over your lifetime, how many years will you spend on each of these activities?
The bar graph shows the average price of new cars in the United Statesand the average age of cars on U.S. roads for two selected years.In 2014, the average price of a new car was $37,600. For the period shown, new-car prices increased by approximately $1250 per year. If this trend continues, how many years after 2014 will the price of a new car average $46,350? In which yearwill this occur?
Draw boxplots (by hand is the easiest) of the data for each year
For the particular Year 2 that you chose, what is the maximum growth rate a country could have and still have a lower growth rate than 75% of the other countries in the world? Explain.
Out of the years you chose, in which year did the smallest growth rate in GDP occur? What is the value and how did you determine it?
Based on your summary statistics, did “Year 1” have higher GDP growth rates than the other two years? Give reasons for your answer. Make sure to not just compare max and min values, but rather use all the values of the 5-number summary and/or a boxplot. You might also argue based on the shape of the distribution and discuss the impact of outliers in your analysis.
Which of the years you chose has the largest variability? Explain
Chapter 5 Solutions
Student Solutions Manual for Introductory Algebra for College Students
Need a deep-dive on the concept behind this application? Look no further. Learn more about this topic, algebra and related others by exploring similar questions and additional content below.
Discrete Distributions: Binomial, Poisson and Hypergeometric | Statistics for Data Science; Author: Dr. Bharatendra Rai;https://www.youtube.com/watch?v=lHhyy4JMigg;License: Standard Youtube License


 Algebra: Structure And Method, Book 1AlgebraISBN:9780395977224Author:Richard G. Brown, Mary P. Dolciani, Robert H. Sorgenfrey, William L. ColePublisher:McDougal Littell
 Holt Mcdougal Larson Pre-algebra: Student Edition...AlgebraISBN:9780547587776Author:HOLT MCDOUGALPublisher:HOLT MCDOUGAL
 Big Ideas Math A Bridge To Success Algebra 1: Stu...AlgebraISBN:9781680331141Author:HOUGHTON MIFFLIN HARCOURTPublisher:Houghton Mifflin Harcourt