
Videos
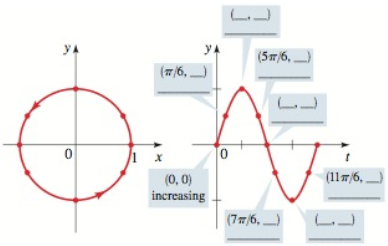
DISCUSS: Phases of Sine The phase of a sine curve y = sin(kt + b) represents a particular location on the graph of the sine function y = sin t. Specifically, when t = 0, we have y = sin b, and this corresponds to the point (b, sin b) on the graph of y = sin t. Observe that each point on the graph of y = sin t has different characteristics. For example, for t = π/6, we have

Trending nowThis is a popular solution!

Chapter 5 Solutions
PRECALCULUS


- Sketch the graph of y=2sinx from x=0 to x=2 by making a table using multiples of /2 for x. What is the amplitude of the graph you obtain?arrow_forwardThe sine curves y1=30sin(6t2) and y2=30sin(6t3) have the same period. a Find the phase of each curve. b Find the phase difference between y1 and y2. c Determine whether the curves are in phase or out of phase. d Sketch both curves on the same axes.arrow_forwardUse addition of y-coordinates to sketch the graph of each of the following between x=0 and x=4. y=1+sinxarrow_forward
 Algebra & Trigonometry with Analytic GeometryAlgebraISBN:9781133382119Author:SwokowskiPublisher:Cengage
 Algebra and Trigonometry (MindTap Course List)AlgebraISBN:9781305071742Author:James Stewart, Lothar Redlin, Saleem WatsonPublisher:Cengage Learning
 Trigonometry (MindTap Course List)TrigonometryISBN:9781305652224Author:Charles P. McKeague, Mark D. TurnerPublisher:Cengage Learning
 Trigonometry (MindTap Course List)TrigonometryISBN:9781337278461Author:Ron LarsonPublisher:Cengage Learning