
Videos
To graph: the system of linear inequalities that represents the situation.
Answer to Problem 46E
The inequalities that represent the given situation are
Explanation of Solution
Given:
It can buy
Concept used:
Graphing the inequalities, it will graph the ordinary linear functions just like it is done before. The difference is that a solution to the inequality is not the drawn line but the area of the coordinate plane that satisfy the inequality. the boundary line is dashed for
There will be two signs for the domain inside the modulus.
If
Calculation:
Write the linear inequalities for the solution where it can buy
Graph the linear inequalities that represents the given situation.
Consider the inequalities to describe the situation where vit can buy no more than
Let
Hence, the inequalities that represent the given situation are:
Graph the inequalities
Graph of the inequalities
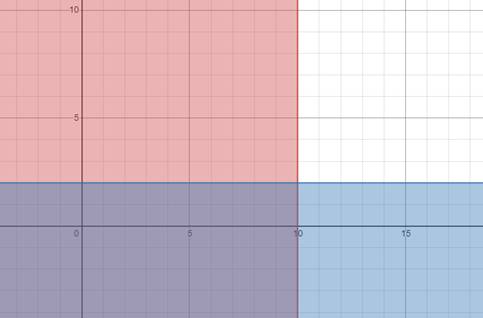
Hence, the graph of linear inequalities that represents the given situation is drawn.
Chapter 5 Solutions
BIG IDEAS MATH Integrated Math 1: Student Edition 2016


 Discrete Mathematics and Its Applications ( 8th I...MathISBN:9781259676512Author:Kenneth H RosenPublisher:McGraw-Hill Education
 Mathematics for Elementary Teachers with Activiti...MathISBN:9780134392790Author:Beckmann, SybillaPublisher:PEARSON
 Thinking Mathematically (7th Edition)MathISBN:9780134683713Author:Robert F. BlitzerPublisher:PEARSON
 Discrete Mathematics With ApplicationsMathISBN:9781337694193Author:EPP, Susanna S.Publisher:Cengage Learning,
 Pathways To Math Literacy (looseleaf)MathISBN:9781259985607Author:David Sobecki Professor, Brian A. MercerPublisher:McGraw-Hill Education