USING+UNDERSTANDING MATH.(LL)-W/MYMATH.
7th Edition
ISBN: 9780135237236
Author: Bennett
Publisher: PEARSON
expand_more
expand_more
format_list_bulleted
Concept explainers
Videos
Textbook Question
Chapter 5.D, Problem 34E
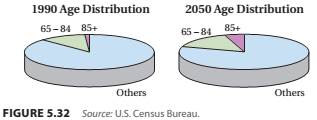
Three-DimensionaI Pies. The pie charts in Figure 5.32 represent the percentage of Americans in three age categories in 1990 and 2050 (projected). Briefly explain how the three dimensional effects create a perceptual distortion in this case. Why would flat pies (without the three-dimensional effects) give a more accurate representation of the data?
Expert Solution & Answer
Want to see the full answer?
Check out a sample textbook solution
Students have asked these similar questions
(Please do not give solution in image format thanku)
How wide is the chasm between what men and women earn in the workplace? According to a 2015 analysis from a
national women's group, women lose $435,049 over the course of a career because of the pay gap. The bar graph to the
right shows the average earnings in the United States for men and women at ages 22 and 55. This exercise involves the
graphs of models for the data shown in the rectangular coordinate system to the right. Complete parts (a) through (c)
below.
BEEB
Average Yearly Earnings in the
U.S., by Gender and Age
M(age=33)=$thousand
(Type an integer or decimal rounded to one decimal place as needed.)
Average Yearly Earnings ($1000s)
70-
60-
Men
50-Women-
40-
30-
20-
10-
0-
22 Age
55
Average Yearly Earnings ($1000s)
A
$70 (3087)
$60-
$30
$20-
$10-
$0
} e
$50 (0.23)
$40
BN 9
ST
(Use integers or decimals for any numbers in the expression. Round to two decimal places as needed.)
b. Use the two points for women shown on the graph to find a function in the form W(x) = mx + b that…
How wide is the chasm between what men and
women earn in the workplace? According to a
2015 analysis from a national women's group,
women lose $435,049 over the course of a
career because of the pay gap. The bar graph
to the right shows the average earnings in the
United States for men and women at ages 22
and 60. This exercise involves the graphs of
models for the data shown in the rectangular
coordinate system to the right. Complete parts
(a) through (c) below.
Average Yearly Earnings ($1000s)
Average Yearly Earnings in the
U.S., by Gender and Age
70-
60-
■Men
50 Women
40-
30-
20-
10-
0-
22 Age 60
Average Yearly Earnings ($1000s)
$70-
$60-
(30,67)..
$50 (0,24)
$40+
$30+
$20-
$10-
$0+
0
M(age=38) = $
thousand
(Type an integer or decimal rounded to one decimal place as needed.)
♦
(0,21)
Men
*(30,40)
Women
10 20 30 40 50
Years after Age 22
--X7
(Use integers or decimals for any numbers in the expression. Round to two decimal places as needed.)
b. Use the two points for women shown on…
Chapter 5 Solutions
USING+UNDERSTANDING MATH.(LL)-W/MYMATH.
Ch. 5.A - You conduct a poll in which you randomly select...Ch. 5.A - Results of the poll described in question 1 would...Ch. 5.A - When we say that a sample is representative of the...Ch. 5.A - A poll concerning support for mass transit is...Ch. 5.A - Consider an experiment designed to test whether...Ch. 5.A - The experiment described in question 4 is a....Ch. 5.A - The purpose of a placebo is a. to prevent...Ch. 5.A - An experiment is single-blind if a. it lacks a...Ch. 5.A - Poll X predicts that Powell will receive 49% of...Ch. 5.A - A survey reveals that 12% of Americans believe...
Ch. 5.A - 1. Why do we say that the term statistics has two...Ch. 5.A - 2. Define the terms populatíon, sample, population...Ch. 5.A - Describe the five basic steps in a statistical...Ch. 5.A - Why is a so important that a statistical study use...Ch. 5.A - Prob. 5ECh. 5.A - Prob. 6ECh. 5.A - What is a placebo? Describe the placebo effect and...Ch. 5.A - What is meant by the margin of error in a survey...Ch. 5.A - In my experimental study, I used a sample that was...Ch. 5.A - I followed all the guidelines for sample selection...Ch. 5.A - I wanted to test the effects of vitamin C on...Ch. 5.A - I don’t believe the results of the experiment...Ch. 5.A - A pollster plans to improve survey results by...Ch. 5.A - By choosing my sample carefully, I can make a good...Ch. 5.A - Population and Sample. For the following studies,...Ch. 5.A - 15–20: Population and Sample. For the following...Ch. 5.A - 15–20: Population and Sample. For the following...Ch. 5.A - In a test of the effectiveness of garlic for...Ch. 5.A - In an Accountemps survey of 150 senior executives,...Ch. 5.A - Population and Sample. For the following studies,...Ch. 5.A - Prob. 21ECh. 5.A - Prob. 22ECh. 5.A - Prob. 23ECh. 5.A - Steps in a Study. Describe how you would apply the...Ch. 5.A - 21-26: Steps in a Study. Describe how you would...Ch. 5.A - Prob. 26ECh. 5.A - Representative Sample? You want to determine the...Ch. 5.A - Representative Sample? You want to determine the...Ch. 5.A - Identify the Sampling Method. Identify the...Ch. 5.A - Identify the Sampling Method. Identify the...Ch. 5.A - Identify the Sampling Method. Identify the...Ch. 5.A - Identify the Sampling Method. Identify the...Ch. 5.A - Identify the Sampling Method. Identify the...Ch. 5.A - Identify the Sampling Method. Identify the...Ch. 5.A - Type of Study. Determine whether the following...Ch. 5.A - Type of Study. Determine whether the following...Ch. 5.A - Type of Study. Determine whether each of the...Ch. 5.A - Type of Study. Determine whether the following...Ch. 5.A - Prob. 39ECh. 5.A - Prob. 40ECh. 5.A - Prob. 41ECh. 5.A - Prob. 42ECh. 5.A - Prob. 43ECh. 5.A - Prob. 44ECh. 5.A - Prob. 45ECh. 5.A - Prob. 46ECh. 5.A - Margin of Error. The following summaries of...Ch. 5.A - A Gallup poll found that 36% of Americans favor a...Ch. 5.A - Margin of Error. The following summaries of...Ch. 5.A - Margin of Error. The following summaries of...Ch. 5.A - Effectiveness of a New Drug. As part of the U.S....Ch. 5.A - Real Studies. Consider the following statistical...Ch. 5.A - Real Studies. Consider the following statistical...Ch. 5.A - Prob. 54ECh. 5.A - 55. A Fox News poll carried out by phone...Ch. 5.A - Prob. 56ECh. 5.A - Prob. 57ECh. 5.A - Prob. 58ECh. 5.A - Statistics in the News. Select three news stories...Ch. 5.A - 62. Statistics in Your Major. Write two to three...Ch. 5.A - Prob. 61ECh. 5.A - Prob. 62ECh. 5.A - 65. Poor Sampling. Find a new article about a...Ch. 5.A - 66. Good Sampling. Find a recent news article that...Ch. 5.A - 67. Margin of Error. Find a report of a recent...Ch. 5.A - Prob. 66ECh. 5.A - Prob. 67ECh. 5.B - You read about an issue that was the subject of an...Ch. 5.B - A study conducted by the oil company Exxon Mobil...Ch. 5.B - Consider a study designed to learn about the...Ch. 5.B - The show The Voice selects winners based on votes...Ch. 5.B - Consider an experiment in which you measure the...Ch. 5.B - Consider a survey in which 1000 people arc asked...Ch. 5.B - Imagine that a survey of randomly selected people...Ch. 5.B - You want to know whether people prefer Smith or...Ch. 5.B - A self-selected survey is one in which a. the...Ch. 5.B - If a statistical study is carefully conducted tn...Ch. 5.B - Prob. 1ECh. 5.B - Prob. 2ECh. 5.B - Prob. 3ECh. 5.B - Prob. 4ECh. 5.B - More than 1 million people sent texts in response...Ch. 5.B - Thc survey of religious beliefs suffered from...Ch. 5.B - My experiment proved beyond a doubt that vitamin C...Ch. 5.B - Everyone who jogs for exercise should try the new...Ch. 5.B - Prob. 9ECh. 5.B - Should You Believe This Study? Based solely on the...Ch. 5.B - 9-20: Should You Believe This Study? Based solely...Ch. 5.B - 9–20: Should You Believe This Study? Based solely...Ch. 5.B - Should You Believe This Study? Based solely on the...Ch. 5.B - Prob. 14ECh. 5.B - Should You Believe This Study? Based solely on the...Ch. 5.B - Should You Believe This Study? Based solely on the...Ch. 5.B - Prob. 17ECh. 5.B - Should You Believe This Study? Based solely on the...Ch. 5.B - Should You Believe This Study? Based solely on the...Ch. 5.B - Prob. 20ECh. 5.B - 21–26: Should You Believe This Claim? Based solely...Ch. 5.B - Prob. 22ECh. 5.B - Prob. 23ECh. 5.B - Prob. 24ECh. 5.B - Prob. 25ECh. 5.B - Should You Believe This Claim? Based solely on the...Ch. 5.B - Prob. 27ECh. 5.B - Prob. 28ECh. 5.B - Bias. Identify at least one potential source of...Ch. 5.B - Prob. 30ECh. 5.B - Bias. Identify at least one potential source of...Ch. 5.B - Prob. 32ECh. 5.B - Prob. 33ECh. 5.B - Prob. 34ECh. 5.B - 35. Its All in the Wording. Princeton Survey...Ch. 5.B - 36. It’s All in the Wording. The Pew Research...Ch. 5.B - Prob. 37ECh. 5.B - Stat-Bytes. Much like sound bytes of news stories,...Ch. 5.B - Prob. 39ECh. 5.B - Prob. 40ECh. 5.B - Prob. 41ECh. 5.B - Prob. 42ECh. 5.B - Accurate Headlines? Consider the following...Ch. 5.B - 43–44: Accurate Headlines? Consider the following...Ch. 5.B - 45. What is the Question? Discuss the differences...Ch. 5.B - 46. Exercise and Dementia. A recent study in the...Ch. 5.B - Prob. 47ECh. 5.B - Prob. 48ECh. 5.B - Prob. 49ECh. 5.B - Prob. 50ECh. 5.B - Prob. 51ECh. 5.C - In a class of 200 students, 50 students received a...Ch. 5.C - For the class described in question 1, what was...Ch. 5.C - Which of the following is an example of...Ch. 5.C - The sizes of the wedges in a pie chart tell you a....Ch. 5.C - You have a table listing ten tourist attractions...Ch. 5.C - In the table of tourist attractions and visitors...Ch. 5.C - You have a list of the GPAs of 100 college...Ch. 5.C - You have a list of the average gasoline price for...Ch. 5.C - A histogram is a. a graph that shows how some...Ch. 5.C - You have a histogram and you want to convert it...Ch. 5.C - Prob. 1ECh. 5.C - Prob. 2ECh. 5.C - Prob. 3ECh. 5.C - Prob. 4ECh. 5.C - Prob. 5ECh. 5.C - 6. What two types of graphs are most common when...Ch. 5.C - I made a frequency table with two columns, one...Ch. 5.C - The relative frequency of B grades in our class...Ch. 5.C - The cumulative frequency of C grades in our class...Ch. 5.C - Your bar graph must be wrong, because you have 10...Ch. 5.C - Your pie chart must be wrong, because when I added...Ch. 5.C - I rearranged the bars on my histogram the tallest...Ch. 5.C - 13-14: Frequency Tables. Make frequency tables for...Ch. 5.C - Prob. 14ECh. 5.C - 15-22: Qualitative versus Quantitative. Determine...Ch. 5.C - Qualitative versus Quantitative. Determine whether...Ch. 5.C - 15-22: Qualitative versus Quantitative. Determine...Ch. 5.C - Qualitative versus Quantitative. Determine whether...Ch. 5.C - Qualitative versus Quantitative. Determine whether...Ch. 5.C - Qualitative versus Quantitative. Determine whether...Ch. 5.C - 15-22: Qualitative versus Quantitative. Determine...Ch. 5.C - Qualitative versus Quantitative. Determine whether...Ch. 5.C - Binned Frequency Tables. Use the given bin sizes...Ch. 5.C - Binned Frequency Tables. Use the given bin sizes...Ch. 5.C - 25. Most Populous Countries. The following table...Ch. 5.C - Prob. 26ECh. 5.C - Prob. 27ECh. 5.C - Prob. 28ECh. 5.C - Prob. 29ECh. 5.C - Prob. 30ECh. 5.C - 31. Cell Phone Subscriptions. The following table...Ch. 5.C - 32. Death Rates. Figure 5.10 is a time-series...Ch. 5.C - U.S. Electrical Energy. The following table gives...Ch. 5.C - Prob. 34ECh. 5.C - Ages of Nobel Prize Winners. The Following...Ch. 5.C - Prob. 36ECh. 5.C - Prob. 37ECh. 5.C - Prob. 38ECh. 5.C - Immigrant Data. The following table gives the...Ch. 5.C - Prob. 40ECh. 5.C - Prob. 41ECh. 5.C - 49. Bar Graph. Find a recent news article tha...Ch. 5.C - 50. Pie Chart. Find a recent news article that...Ch. 5.C - 51. Histogram. Find a recent news article that...Ch. 5.C - 52. Line Chart. Find a recent news article that...Ch. 5.C - Answer the following questions using procedures...Ch. 5.C - 47. U.S. Population in Poverty. Use Excel or with...Ch. 5.C - 48. StatCrunch Data Entry. To gain practice...Ch. 5.C - 49. NFL Data. Open the shared data set called NFL...Ch. 5.C - Prob. 50ECh. 5.D - Based on Figure 5.12, which statement is correct?...Ch. 5.D - Prob. 2QQCh. 5.D - Prob. 3QQCh. 5.D - Prob. 4QQCh. 5.D - Prob. 5QQCh. 5.D - Prob. 6QQCh. 5.D - Which of the following best describes the...Ch. 5.D - Prob. 8QQCh. 5.D - 9. Consider Figure 5.22(a). Moving one tick mark...Ch. 5.D - 10. Consider Figure 5.23(a). In years where the...Ch. 5.D - Briefly describe the construction and use of...Ch. 5.D - What are geographical data? Briefly describe at...Ch. 5.D - What are three-dimensional graphics? Explain the...Ch. 5.D - What are infographics, and what is their goal?Ch. 5.D - Prob. 5ECh. 5.D - 6. What is an exponential scale? When is an...Ch. 5.D - Explain how a graph that shows percentage change...Ch. 5.D - Prob. 8ECh. 5.D - My bar chart contains more information than yours,...Ch. 5.D - 10. I used an exponential scale because the data...Ch. 5.D - Prob. 11ECh. 5.D - A graph showing the yearly rate of increase in the...Ch. 5.D - Educational Value. Use the graphs in Figure 5.11...Ch. 5.D - 13-16: Educational Value. Use the graphs in Figure...Ch. 5.D - Prob. 15ECh. 5.D - Prob. 16ECh. 5.D - Gender and Mathematics. Consider the data...Ch. 5.D - Gender and Science. The following table gives data...Ch. 5.D - Prob. 19ECh. 5.D - Prob. 20ECh. 5.D - Disease Stack Plot. Use Figure 5.14 to answer the...Ch. 5.D - Disease Stack Plot. Use Figure 5.14 to answer the...Ch. 5.D - 23. Figure 5.24 shows a stack plot of federal...Ch. 5.D - 24. College Degrees. Figure 5.25 shows the numbers...Ch. 5.D - 25-26: Melanoma Mortality. Figure 5.26 shows the...Ch. 5.D - Prob. 26ECh. 5.D - Prob. 27ECh. 5.D - Prob. 28ECh. 5.D - Prob. 29ECh. 5.D - Prob. 30ECh. 5.D - Prob. 31ECh. 5.D - Infographic. Use Figure 5.18 to answer the...Ch. 5.D - Volume Distortion. Figure 5.29 depicts the amounts...Ch. 5.D - Three-DimensionaI Pies. The pie charts in Figure...Ch. 5.D - Refugees to Europe. Figure 5.31 shows the numbers...Ch. 5.D - 36. Life Expectancy. Figure 5.32 shows the life...Ch. 5.D - 37. Moore’s Law. Moore law refers to a prediction...Ch. 5.D - Prob. 38ECh. 5.D - Prob. 39ECh. 5.D - Percentage Change in the CPI. Figure 5.33 shows...Ch. 5.D - Prob. 41ECh. 5.D - Prob. 42ECh. 5.D - Prob. 43ECh. 5.D - Prob. 44ECh. 5.D - Prob. 45ECh. 5.D - Prob. 46ECh. 5.D - 47-52: Creating Graphics. Make a graphical display...Ch. 5.D - 47-52: Creating Graphics. Make a graphical display...Ch. 5.D - Creating Graphics. Make a graphical display of the...Ch. 5.D - Prob. 50ECh. 5.D - Prob. 51ECh. 5.D - Prob. 52ECh. 5.D - Prob. 53ECh. 5.D - Prob. 54ECh. 5.D - Prob. 55ECh. 5.D - Prob. 56ECh. 5.D - Prob. 57ECh. 5.D - Prob. 58ECh. 5.D - Prob. 59ECh. 5.D - 46. Interactive Infographics. Find a few examples...Ch. 5.D - Answer the following questions using procedures...Ch. 5.D - Answer the following questions using procedures...Ch. 5.D - Prob. 63ECh. 5.D - Prob. 64ECh. 5.D - Prob. 65ECh. 5.D - Answer the following questions using procedures...Ch. 5.D - Prob. 67ECh. 5.D - Prob. 68ECh. 5.E - If X is correlated with Y, a. X causes Y. b....Ch. 5.E - Figure 5.40. According to this diagram, life...Ch. 5.E - If the points on a scatterplot fall on a nearly...Ch. 5.E - If the points on a scatterplot fall into a broad...Ch. 5.E - When can you rule out the possibility that changes...Ch. 5.E - What type of correlation would you expect between...Ch. 5.E - You have found a higher rate of birth defects...Ch. 5.E - Based on the data in Figure 5.38, abou how much...Ch. 5.E - Which of the following statements best describes...Ch. 5.E - A finding by a jury that a pcrson is guilty...Ch. 5.E - What is a correlation? Give three examples of...Ch. 5.E - What is a scatterplot, and how is one made? How...Ch. 5.E - Prob. 3ECh. 5.E - Describe the three general categories of...Ch. 5.E - 5. Briefly describe each of the six guidelines...Ch. 5.E - Briefly describe three levels of confidence in...Ch. 5.E - There is a strong negative correlation between the...Ch. 5.E - There is a strong positive correlation between the...Ch. 5.E - I found a nearly perfect positive correlation...Ch. 5.E - I found a nearly perfect negative correlation...Ch. 5.E - I had originally suspected that an increase in...Ch. 5.E - Prob. 12ECh. 5.E - Interpreting Scatterplots. Consider the following...Ch. 5.E - Interpreting Scatterplots. Consider the following...Ch. 5.E - Interpreting Scatterplots. Consider the following...Ch. 5.E - Interpreting Scatterplots. Consider the following...Ch. 5.E - Types of Correlation. For the following pairs of...Ch. 5.E - Types of Correlation. For the following pairs of...Ch. 5.E - Types of Correlation. For the following pairs of...Ch. 5.E - Prob. 20ECh. 5.E - Prob. 21ECh. 5.E - Prob. 22ECh. 5.E - 17–24: Types of Correlation. For the following...Ch. 5.E - Prob. 24ECh. 5.E - Prob. 25ECh. 5.E - Making Scatterplots. Consider the following data...Ch. 5.E - Making Scatterplots. Consider the following data...Ch. 5.E - Prob. 28ECh. 5.E - Prob. 29ECh. 5.E - Making Scatterplots. Consider the following data...Ch. 5.E - Federal Aid and Graduation Rates. Figure 5.43...Ch. 5.E - Correlation and Causality. Consider the following...Ch. 5.E - Correlation and Causality. Consider the following...Ch. 5.E - Correlation and Causality. Consider the following...Ch. 5.E - Correlation and Causality. Consider the following...Ch. 5.E - Correlation and Causality. Consider the following...Ch. 5.E - Correlation and Causality. Consider the following...Ch. 5.E - 38. Identifying Causes: Headaches. You are trying...Ch. 5.E - 39. Smoking and Lung Cancer. There is a strong...Ch. 5.E - Prob. 40ECh. 5.E - Prob. 41ECh. 5.E - Prob. 42ECh. 5.E - Prob. 43ECh. 5.E - Prob. 44ECh. 5.E - Prob. 45ECh. 5.E - Prob. 46ECh. 5.E - Prob. 47ECh. 5.E - Answer the following questions using procedures...Ch. 5.E - Exercise and TV Open the shared data set called...Ch. 5.E - 50. StatCrunch Project. Choose one data set...
Knowledge Booster


Learn more about
Need a deep-dive on the concept behind this application? Look no further. Learn more about this topic, subject and related others by exploring similar questions and additional content below.Similar questions
- PART I: For this part, we will divide the data set into two groups: those who have infection and those who do not. Consider only those who have an infection.1. For these subjects only, construct a stemplot for the variable “heart rate”. (We will be making this into a back-to-back stemplot later, so leave room on the left side.)2. Discuss the shape of your stemplot. Is it symmetric? Positively skewed? Negatively skewed? None of these? Are there any outliers?3. How would you describe the center and the spread of this distribution?4. Find the five-number summary.5. Construct a box plot.arrow_forwardPart II Show all of your work. Write the answer in the space provided. ows 11. The ages of 25 people who recently passed the certified quality engineering exam (CQE) are given in the table. 28 33 43 29 37 44 38 29 39 44 29 33 42 39 36 42 28 35 39 42 Construct a dot plot for the data. 39 43 29 32 37 26 27 28 29 30 31 32 33 34 35 36 37 38 39 40 41 42 43 44 45 46arrow_forwardQuestion A data set lists the number squirrels spotted by visitors at the park during the last weekend. For this data set, the minimum is 4, the first quartile is 12, the median is 13, the third quartile is 15, and the maximum is 16. First, slide the median into place. Then, move the existing lines and boxes to construct a correct box-and-whisker plot that shows the number of squirrels spotted by visitors. Begin by first placing the middle dot on the median. Then work on placing the rest of the points starting with the ones closest to the median. Provide your answer below: = Nearrow_forward
- A parallel coordinates plot, stretches or condenses the vertical axes so they look to be the same height for cach variable. This ables the rcader to see patterns in the relationship between variables across subjects. The graph below plots seasonal data for baseball players playing two different positions: • first base (1B), the solid blue line • second base (2B) the dashed red line. Players are compared across the three dimensions: • home runs (number of home runs hit) • steals (bases stolen) • batting average Home Runs Steals Average Cyyc yc Q. Looking at the data for first base (1B) players, which of the following statements is accurate for the sample? A. They steal bases quite often. B. Of the three variables the players batting average is the most consistent. • C. Using this graph, if you know how many homes runs a player hit, then you can estimate the steals for that player. Q. Looking at the data for second base (2B) players, which of the following statements is accurate for the…arrow_forwardSolve the image problemarrow_forwardThe following table shows the length, in centimeters, of the humerus and the total wingspan, in centimeters, of several pterosaurs, which are extinct flying reptiles.arrow_forward
arrow_back_ios
arrow_forward_ios
Recommended textbooks for you
 Big Ideas Math A Bridge To Success Algebra 1: Stu...AlgebraISBN:9781680331141Author:HOUGHTON MIFFLIN HARCOURTPublisher:Houghton Mifflin Harcourt
 Glencoe Algebra 1, Student Edition, 9780079039897...AlgebraISBN:9780079039897Author:CarterPublisher:McGraw Hill
 Trigonometry (MindTap Course List)TrigonometryISBN:9781337278461Author:Ron LarsonPublisher:Cengage Learning
 Algebra & Trigonometry with Analytic GeometryAlgebraISBN:9781133382119Author:SwokowskiPublisher:Cengage
 Holt Mcdougal Larson Pre-algebra: Student Edition...AlgebraISBN:9780547587776Author:HOLT MCDOUGALPublisher:HOLT MCDOUGAL
Big Ideas Math A Bridge To Success Algebra 1: Stu...
Algebra
ISBN:9781680331141
Author:HOUGHTON MIFFLIN HARCOURT
Publisher:Houghton Mifflin Harcourt
Glencoe Algebra 1, Student Edition, 9780079039897...
Algebra
ISBN:9780079039897
Author:Carter
Publisher:McGraw Hill
Trigonometry (MindTap Course List)
Trigonometry
ISBN:9781337278461
Author:Ron Larson
Publisher:Cengage Learning
Algebra & Trigonometry with Analytic Geometry
Algebra
ISBN:9781133382119
Author:Swokowski
Publisher:Cengage
Holt Mcdougal Larson Pre-algebra: Student Edition...
Algebra
ISBN:9780547587776
Author:HOLT MCDOUGAL
Publisher:HOLT MCDOUGAL
The Shape of Data: Distributions: Crash Course Statistics #7; Author: CrashCourse;https://www.youtube.com/watch?v=bPFNxD3Yg6U;License: Standard YouTube License, CC-BY
Shape, Center, and Spread - Module 20.2 (Part 1); Author: Mrmathblog;https://www.youtube.com/watch?v=COaid7O_Gag;License: Standard YouTube License, CC-BY
Shape, Center and Spread; Author: Emily Murdock;https://www.youtube.com/watch?v=_YyW0DSCzpM;License: Standard Youtube License