
Concept explainers
Videos
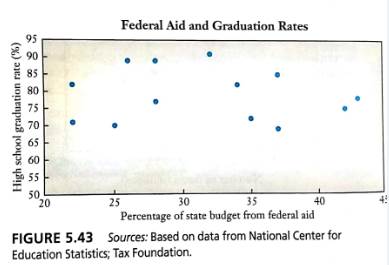
Federal Aid and Graduation Rates. Figure 5.43 shows the high school graduation rates for 13 selected states and the percentage of each state’s budget coming from Federal aid.
a. Based on the
b. The data include the minimum and maximum values in both categories (federal aid and graduation rates). Does the graph accurately reflect the true range of graduation rates across these states? Does the graph accurately reflect the true range of federal aid across these states? Explain.
Want to see the full answer?
Check out a sample textbook solution
Chapter 5 Solutions
Using & Understanding Mathematics: A Quantitative Reasoning Approach with Integrated Review, Loose-Leaf Edition Plus MyLab Math with Pearson eText -- 18 Week Access Card Package


 Glencoe Algebra 1, Student Edition, 9780079039897...AlgebraISBN:9780079039897Author:CarterPublisher:McGraw Hill
 Holt Mcdougal Larson Pre-algebra: Student Edition...AlgebraISBN:9780547587776Author:HOLT MCDOUGALPublisher:HOLT MCDOUGAL
 Big Ideas Math A Bridge To Success Algebra 1: Stu...AlgebraISBN:9781680331141Author:HOUGHTON MIFFLIN HARCOURTPublisher:Houghton Mifflin Harcourt