Intro Stats - Study Card
4th Edition
ISBN: 9780321826268
Author: DeVeaux
Publisher: PEARSON
expand_more
expand_more
format_list_bulleted
Concept explainers
Videos
Textbook Question
Chapter 6, Problem 17E
Firing pottery A ceramics factory can fire eight large batches of pottery a day. Sometimes a few of the pieces break in the process. In order to understand the problem better, the factory records the number of broken pieces in each batch for 3 days and then creates the
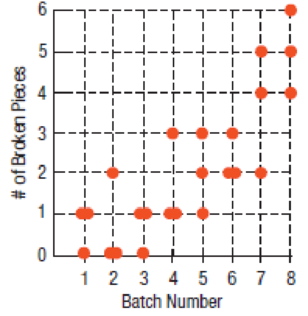
- a) Make a histogram showing the distribution of the number of broken pieces in the 24 batches of pottery examined.
- b) Describe the distribution as shown in the histogram. What feature of the problem is more apparent in the histogram than in the scatterplot?
- c) What aspect of the company’s problem is more apparent in the scatterplot?
Expert Solution & Answer
Want to see the full answer?
Check out a sample textbook solution
Chapter 6 Solutions
Intro Stats - Study Card
Ch. 6.2 - Your statistics instructor tells you that the...Ch. 6.2 - Your statistics instructor tells you that the...Ch. 6.2 - Your statistics instructor tells you that the...Ch. 6.2 - Prob. 4JCCh. 6.2 - Prob. 5JCCh. 6 - Association Suppose you were to collect data for...Ch. 6 - Association II Suppose you were to collect data...Ch. 6 - Bookstore sales Consider the following data from a...Ch. 6 - Prob. 4ECh. 6 - Prob. 5E
Ch. 6 - Correlation facts II If we assume that the...Ch. 6 - Prob. 7ECh. 6 - Prob. 8ECh. 6 - Prob. 9ECh. 6 - Prob. 10ECh. 6 - Association III Suppose you were to collect data...Ch. 6 - Prob. 12ECh. 6 - Prob. 13ECh. 6 - Prob. 14ECh. 6 - Prob. 15ECh. 6 - Prob. 16ECh. 6 - Firing pottery A ceramics factory can fire eight...Ch. 6 - Coffee sales Owners of a new coffee shop tracked...Ch. 6 - Matching Here are several scatterplots. The...Ch. 6 - Matching II Here are several scatterplots. The...Ch. 6 - Prob. 21ECh. 6 - Car thefts The National Insurance Crime Bureau...Ch. 6 - Prob. 23ECh. 6 - Antidepressants A study compared the effectiveness...Ch. 6 - Streams and hard water In a study of streams in...Ch. 6 - Traffic headaches A study of traffic delays in 68...Ch. 6 - Cold nights Is there an association between time...Ch. 6 - Association V A researcher investigating the...Ch. 6 - Prob. 29ECh. 6 - Prob. 30ECh. 6 - Correlation errors Your Economics instructor...Ch. 6 - More correlation errors Students in the Economics...Ch. 6 - Height and reading A researcher studies children...Ch. 6 - Prob. 34ECh. 6 - Correlation conclusions I The correlation between...Ch. 6 - Prob. 36ECh. 6 - Prob. 37ECh. 6 - Sample survey A polling organization is checking...Ch. 6 - Income and housing The Office of Federal Housing...Ch. 6 - Prob. 40ECh. 6 - 41. Fuel economy 2010 Here are advertised...Ch. 6 - Drug abuse A survey was conducted in the United...Ch. 6 - Prob. 43ECh. 6 - Burgers again In the previous exercise you...Ch. 6 - Prob. 45ECh. 6 - 46. Second inning 2010 Perhaps fans are just more...Ch. 6 - Prob. 47ECh. 6 - Prob. 48ECh. 6 - Prob. 49ECh. 6 - Vehicle weights The Minnesota Department of...Ch. 6 - Prob. 51ECh. 6 - Prob. 52E
Additional Math Textbook Solutions
Find more solutions based on key concepts
(a) For each data set, find the mean, median, and mode. (b) Discuss anything about the data that affects the us...
APPLIED STAT.IN BUS.+ECONOMICS
In Hamilton County, Ohio, the mean number of days needed to sell a house is 86 days (Cincinnati Multiple Listin...
STATISTICS F/BUSINESS+ECONOMICS-TEXT
Individuals in Jake’s study.
The Practice of Statistics for AP - 4th Edition
10. Explain the steps in designing an experiment.
Fundamentals of Statistics (5th Edition)
Empirical versus Theoretical A Monopoly player claims that the probability of getting a 4 when rolling a six-si...
Introductory Statistics (2nd Edition)
the type of variable is the response.
Stats: Modeling the World Nasta Edition Grades 9-12
Knowledge Booster


Learn more about
Need a deep-dive on the concept behind this application? Look no further. Learn more about this topic, statistics and related others by exploring similar questions and additional content below.Recommended textbooks for you
 Big Ideas Math A Bridge To Success Algebra 1: Stu...AlgebraISBN:9781680331141Author:HOUGHTON MIFFLIN HARCOURTPublisher:Houghton Mifflin Harcourt
 Glencoe Algebra 1, Student Edition, 9780079039897...AlgebraISBN:9780079039897Author:CarterPublisher:McGraw Hill
 Holt Mcdougal Larson Pre-algebra: Student Edition...AlgebraISBN:9780547587776Author:HOLT MCDOUGALPublisher:HOLT MCDOUGAL
Big Ideas Math A Bridge To Success Algebra 1: Stu...
Algebra
ISBN:9781680331141
Author:HOUGHTON MIFFLIN HARCOURT
Publisher:Houghton Mifflin Harcourt
Glencoe Algebra 1, Student Edition, 9780079039897...
Algebra
ISBN:9780079039897
Author:Carter
Publisher:McGraw Hill
Holt Mcdougal Larson Pre-algebra: Student Edition...
Algebra
ISBN:9780547587776
Author:HOLT MCDOUGAL
Publisher:HOLT MCDOUGAL
Which is the best chart: Selecting among 14 types of charts Part II; Author: 365 Data Science;https://www.youtube.com/watch?v=qGaIB-bRn-A;License: Standard YouTube License, CC-BY