
Videos
(a)
Find which one is the biggest area among the two areas or check whether the two areas or equal or not.
(a)
Answer to Problem 19CAP
The area above the mean and the area below the mean is same.
Explanation of Solution
Calculation:
The given information is that the set of data is distributed normally with mean 3.5 and standard deviation 0.6.
Assume that the random variable X belongs to the set of the data.
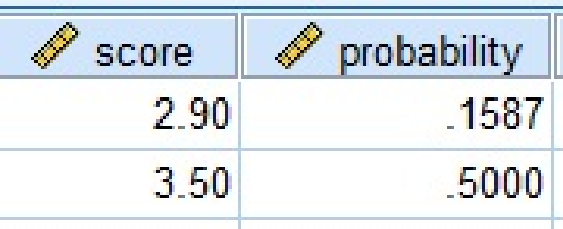
The area below the mean is,
Software procedure:
Step by step procedure to obtain the probability by using SPSS software as follows:
- Go to Variable View, enter the variable name as Score and make Decimals column as 4.
- Go to Data View, enter the value in score column as 3.5.
- Go to Transform tab, choose Compute Variables.
- Enter Target variable as probabilty.
- Choose CDF &non-central CDF from the function group then select Cdf.Normal from the
functions . - In Numeric Expression CDF.NORMAL (pro, mean, stddev), choose the first variable as Scores from the left side tab, enter second variable as 3.5 and third variable as 0.6.
- Click on OK.
Output using SPSS software is given as follows:
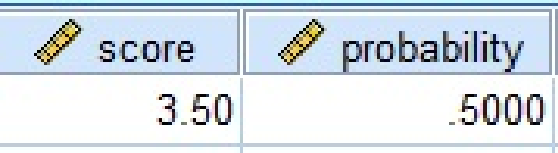
From the output, the value of
The area below the mean is 0.5000.
The area above the mean is,
The area above the mean is 0.5000.
Thus, the area above the mean and the area below the mean is same.
(b)
Find which one is the biggest area among the two areas or check whether the two areas or equal or not.
(b)
Answer to Problem 19CAP
The area between the value of 2.9 and 4.1 is higher than the area between the values of 3.5 and 4.7.
Explanation of Solution
Calculation:
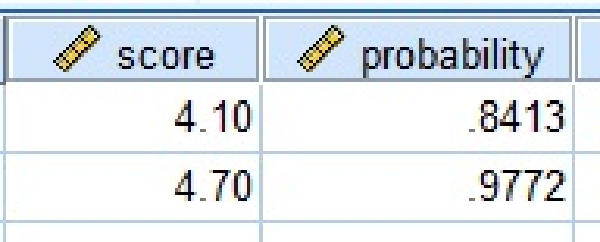
The area between the values 2.9 and 4.1 is,
Software procedure:
Step by step procedure to obtain the probability by using SPSS software as follows:
- Go to Variable View, enter the variable name as Score.
- Go to Data View, enter the value in score column as 4.1 and 2.9.
- Go to Transform tab, choose Compute Variables.
- Enter Target variable as probabilty.
- Choose CDF &non-central CDF from the function group then select Cdf.Normal from the functions.
- In Numeric Expression CDF.NORMAL (pro, mean, stddev), choose the first variable as Score from the left side tab, enter second variable as 3.5 and third variable as 0.6.
- Click on OK.
Output using SPSS software is given as follows:
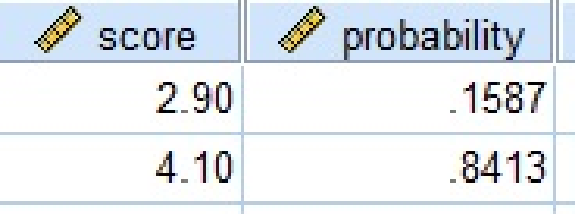
From the output, the value of
The area between the values of 2.9 and 4.1 is,
The area between the values of 2.9 and 4.1 is 0.6826.
The area between the values 3.5 and 4.7 is,
Software procedure:
Step by step procedure to obtain the probability by using SPSS software as follows:
- Go to Variable View, enter the variable name as Score.
- Go to Data View, enter the value in score column as 3.5 and 4.7.
- Go to Transform tab, choose Compute Variables.
- Enter Target variable as probabilty.
- Choose CDF &non-central CDF from the function group then select Cdf.Normal from the functions.
- In Numeric Expression CDF.NORMAL (pro, mean, stddev), choose the first variable as Score from the left side tab, enter second variable as 3.5 and third variable as 0.6.
- Click on OK.
Output using SPSS software is given as follows:
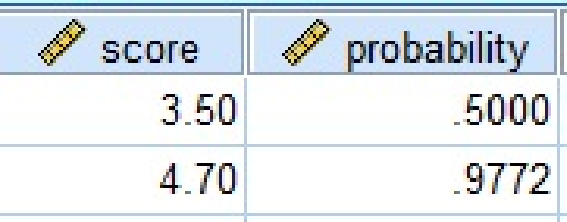
From the output, the value of
The area between the values of 3.5 and 4.7 is,
The area between the values of 3.5 and 4.7 is 0.4772.
Thus, the area between the value of 2.9 and 4.1 is higher than the area between the values of 3.5 and 4.7.
(c)
Find which one is the biggest area among the two areas or check whether the two areas or equal or not.
(c)
Answer to Problem 19CAP
The area between the value mean and 3.5 is lower than the area above the value 5.3.
Explanation of Solution
Calculation:
The value of the mean is 3.5.
The area between the values mean and 3.5 is,
The area between the values of mean and 3.5 is 0.
The area above the value 5.3 is,
Software procedure:
Step by step procedure to obtain the probability by using SPSS software as follows:
- Go to Variable View, enter the variable name as Score.
- Go to Data View, enter the value in score column as 5.3.
- Go to Transform tab, choose Compute Variables.
- Enter Target variable as probabilty.
- Choose CDF &non-central CDF from the function group then select Cdf.Normal from the functions.
- In Numeric Expression CDF.NORMAL (pro, mean, stddev), choose the first variable as Score from the left side tab, enter second variable as 3.5 and third variable as 0.6.
- Click on OK.
Output using SPSS software is given as follows:
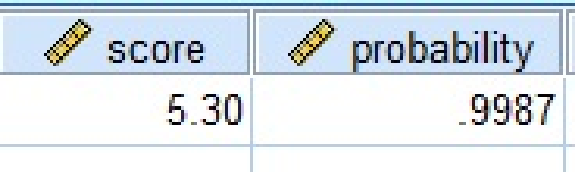
From the output, the value of
The area above 5.3 is,
The area above the value 5.3 is 0.0013.
Thus, the area between the value mean and 3.5 is lower than the area above the value 5.3.
(d)
Find which one is the biggest area among the two areas or check whether the two areas or equal or not.
(d)
Answer to Problem 19CAP
The area below 3.6 is equal to the area above 3.4.
Explanation of Solution
Calculation:
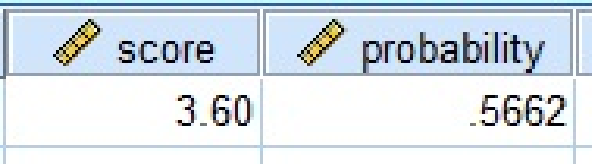
The area below 3.6 is,
Software procedure:
Step by step procedure to obtain the probability by using SPSS software as follows:
- Go to Variable View, enter the variable name as Score.
- Go to Data View, enter the value in score column as 3.6.
- Go to Transform tab, choose Compute Variables.
- Enter Target variable as probabilty.
- Choose CDF &non-central CDF from the function group then select Cdf.Normal from the functions.
- In Numeric Expression CDF.NORMAL (pro, mean, stddev), choose the first variable as Score from the left side tab, enter second variable as 3.5 and third variable as 0.6.
- Click on OK.
Output using SPSS software is given as follows:
From the output, the value of
The area below 3.6 is 0.5662.
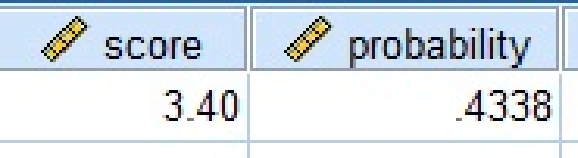
The area above 3.4 is,
Software procedure:
Step by step procedure to obtain the probability by using SPSS software as follows:
- Go to Variable View, enter the variable name as Score.
- Go to Data View, enter the value in score column as 3.4.
- Go to Transform tab, choose Compute Variables.
- Enter Target variable as probabilty.
- Choose CDF &non-central CDF from the function group then select Cdf.Normal from the functions.
- In Numeric Expression CDF.NORMAL (pro, mean, stddev), choose the first variable as Score from the left side tab, enter second variable as 3.5 and third variable as 0.6.
- Click on OK.
Output using SPSS software is given as follows:
From the output, the value of
The area above 3.4 is,
The area above 3.4 is 0.5662.
Thus, the area below 3.6 is equal to the area above 3.4.
(e)
Find which one is the biggest area among the two areas or check whether the two areas or equal or not.
(e)
Answer to Problem 19CAP
The area between the 4.1 and 4.7 is lower than the area between the 2.9 and 3.5.
Explanation of Solution
Calculation:
The area between 4.1 and 4.7 is,
Software procedure:
Step by step procedure to obtain the probability by using SPSS software as follows:
- Go to Variable View, enter the variable name as Score.
- Go to Data View, enter the value in score column as 4.1 and 4.7.
- Go to Transform tab, choose Compute Variables.
- Enter Target variable as probabilty.
- Choose CDF &non-central CDF from the function group then select Cdf.Normal from the functions.
- In Numeric Expression CDF.NORMAL (pro, mean, stddev), choose the first variable as Score from the left side tab, enter second variable as 3.5 and third variable as 0.6.
- Click on OK.
Output using SPSS software is given as follows:
From the output, the value of
The area between 4.1 and 4.7 is 0.1359.
The area between 2.9 and 3.5 is,
Software procedure:
Step by step procedure to obtain the probability by using SPSS software as follows:
- Go to Variable View, enter the variable name as Score.
- Go to Data View, enter the value in score column as 2.9 and 3.5.
- Go to Transform tab, choose Compute Variables.
- Enter Target variable as probabilty.
- Choose CDF &non-central CDF from the function group then select Cdf.Normal from the functions.
- In Numeric Expression CDF.NORMAL (pro, mean, stddev), choose the first variable as Score from the left side tab, enter second variable as 3.5 and third variable as 0.6.
- Click on OK.
Output using SPSS software is given as follows:
From the output, the value of
The area between 2.9 and 3.5 is 0.3413.
Thus, the area between the 4.1 and 4.7 is lower than the area between the 2.9 and 3.5.
Want to see more full solutions like this?
Chapter 6 Solutions
Statistics for the Behavioral Sciences


 Glencoe Algebra 1, Student Edition, 9780079039897...AlgebraISBN:9780079039897Author:CarterPublisher:McGraw Hill