
Concept explainers
Videos
Bone Density Test. In Exercises 1–4, assume that scores on a bone mineral density test are
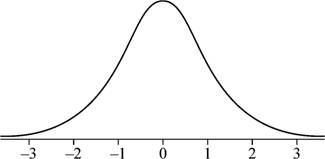
1. Bone Density Sketch a graph showing the shape of the distribution of bone density test scores.
To sketch: The graph showing the shape of the distribution of the bone mineral density test scores.
Answer to Problem 1CQQ
Explanation of Solution
Given info:
The bone density test scores follow a normal distribution with mean of 0 and standard deviation of 1.
Justification:
Here, the bone density test follows a normal distribution. Also, the graph of the normal distribution is bell shaped and is symmetric about the mean. Moreover, if the mean and standard deviation are 0 and 1, respectively, the distribution is known as standard normal distribution. Hence, the graph of the bone density test scores is bell-shaped
Want to see more full solutions like this?
Chapter 6 Solutions
Elementary Stats Book ALC & SSM Pkg


 MATLAB: An Introduction with ApplicationsStatisticsISBN:9781119256830Author:Amos GilatPublisher:John Wiley & Sons Inc
 Probability and Statistics for Engineering and th...StatisticsISBN:9781305251809Author:Jay L. DevorePublisher:Cengage Learning
 Statistics for The Behavioral Sciences (MindTap C...StatisticsISBN:9781305504912Author:Frederick J Gravetter, Larry B. WallnauPublisher:Cengage Learning
 Elementary Statistics: Picturing the World (7th E...StatisticsISBN:9780134683416Author:Ron Larson, Betsy FarberPublisher:PEARSON
 The Basic Practice of StatisticsStatisticsISBN:9781319042578Author:David S. Moore, William I. Notz, Michael A. FlignerPublisher:W. H. Freeman
 Introduction to the Practice of StatisticsStatisticsISBN:9781319013387Author:David S. Moore, George P. McCabe, Bruce A. CraigPublisher:W. H. Freeman