Concept explainers
Videos
21. The line graph showy ‘he cost of inflation. What cost$10,000 in 1984 would cost the amount shown by thegraph in subsequent years.
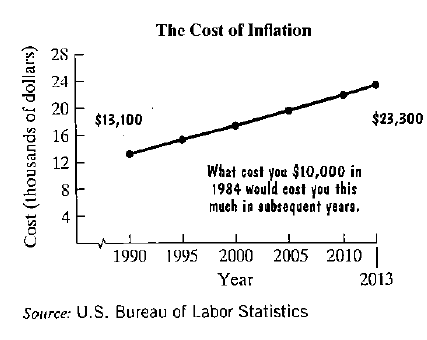
Here are two mathematical models for tie data shown by the graph. In each formula. C represents the cost x yearsafter 1990 or what cost $10,000 in 1984.
Model 1
Model 2
a. Use the graph to estimate the cost in 2010, to the nearestthousand dollars, of what cost $10,000 in 1984 $22,000
b. Use model 1 to determine the cost in 2010 How welldoes this describe your estimate from part (a)? $21,809: reasonably well
c. Use model 2 to determine the cost in 2010. How welldoes this describe your estimate from pan (a)? $21,726: reasonably well
d. Use model 1 to determine in which year the cost will be$26,229 for what cost$10,000 in 1984 2020
Want to see the full answer?
Check out a sample textbook solution
Chapter 6 Solutions
Thinking Mathematically, Books A La Carte Edition Format: Unbound (saleable)


- Graph on the number line: (a) x2 (b) x3 (c) x1arrow_forwardSales Barnes & Noble had annual sales of $6.8 billion in 2013 and $6.1 billion in 2015. Use the Midpoint Formula to estimate the sales in 2014. Assume that the annual sales followed a linear pattern.arrow_forwardGraph on the number line: (a) x1 (b) x2 (c) x3arrow_forward
- The bar graph shows the average cost of tuition and fees at private four-year colleges in a particular country. Below are two mathematical models for the data shown in the graph. In each formula, T represents the average cost of tuition and fees at private colleges for the school year ending x years after 2000. Answer parts a and b. Average Cost of Tuition and Fees at Private Four-Year Colleges 22 20- 22,051 21,057 20,095 19,128 18,135 18- 16.203 16 15 218 17,168 Model 1 T= 974x+ 15,223 Model 2 T= - 2.1x + 988x + 15,208 14 2000 2001 20022003 2004 2005 2006 2007 a. Use each model to find the average cost of tuition and fees at private colleges for the school vear ending in 2003. By how much does each model underestimate or overestimate the actual cost shown for the school year ending in 2003? HIHE The average cost given by model 1 is $ Round to the nearest dollar.) Help Me Solve This Textbook Get More Help - Clear All Skill Builder Check Answer 10.19 PM 65°F 9/6/2021 Type here to search…arrow_forwardPrice (in Dollars) 50 4. The following line graph shows the price of a stock over the previous two weeks. Use the graph to determine the number of days in which the price was between $50 and $60. Value of Stock for Two Weeks 80 70- 60 40 1 2 3 4 5 6 7 8 9 10 11 12 13 14 Day Answer:arrow_forward3. Write an equation of a line that is parallel to y = 5 - %xarrow_forward
 Glencoe Algebra 1, Student Edition, 9780079039897...AlgebraISBN:9780079039897Author:CarterPublisher:McGraw Hill
 Calculus For The Life SciencesCalculusISBN:9780321964038Author:GREENWELL, Raymond N., RITCHEY, Nathan P., Lial, Margaret L.Publisher:Pearson Addison Wesley,
 Trigonometry (MindTap Course List)TrigonometryISBN:9781337278461Author:Ron LarsonPublisher:Cengage Learning
 Elementary AlgebraAlgebraISBN:9780998625713Author:Lynn Marecek, MaryAnne Anthony-SmithPublisher:OpenStax - Rice University