
Concept explainers
Videos
Sales Let S represent sales of a new product (in thousands of units), let L, represent the maximum level of sales (in thousands of units), and let t represent time (in months). The rate of change of S with respect to t is proportional to the product of S and
(a) Write the
When t = 0: L = 100, S = 10
When t = 1: S = 20
Verify that
(b) At what time is the growth in sales increasing most rapidly?
(c) Use a graphing utility to graph the sales function.
(d) Sketch the solution from part (a) on the slope field below. To print an enlarged copy of the graph, go to MathGraphs.com.
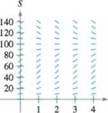
(e) Assume the estimated maximum level of sales is correct. Use the slope field to describe the shape of the solution curves for sales when, at some period of time, sales exceed L.
Want to see the full answer?
Check out a sample textbook solution
Chapter 6 Solutions
CALCULUS EARLY TRANSCENDENTAL FUNCTIONS


 Calculus For The Life SciencesCalculusISBN:9780321964038Author:GREENWELL, Raymond N., RITCHEY, Nathan P., Lial, Margaret L.Publisher:Pearson Addison Wesley,
 Glencoe Algebra 1, Student Edition, 9780079039897...AlgebraISBN:9780079039897Author:CarterPublisher:McGraw Hill
 Algebra & Trigonometry with Analytic GeometryAlgebraISBN:9781133382119Author:SwokowskiPublisher:Cengage