Women's Heights Assume for this question that college women's heights are approximately Normally distributed with a mean of 64.6 inches and a standard deviation of 2.6 inches. Draw a well-labeled Normal curve for each part. a. Find the percentage of women who should have heights of 63.5 inches or less. b. In a sample of 123 women, according to the probability obtained in part a, how many should have heights of 63.5 inches or less? c. The table shows the frequencies of heights for a sample of women, collected by statistician Brian Joiner in his statistics class. Count the women who appear to have heights of 63 inches or less by looking at the table. They are in the oval. d. Are the answers to parts b and c the same or different? Explain.
Women's Heights Assume for this question that college women's heights are approximately Normally distributed with a mean of 64.6 inches and a standard deviation of 2.6 inches. Draw a well-labeled Normal curve for each part. a. Find the percentage of women who should have heights of 63.5 inches or less. b. In a sample of 123 women, according to the probability obtained in part a, how many should have heights of 63.5 inches or less? c. The table shows the frequencies of heights for a sample of women, collected by statistician Brian Joiner in his statistics class. Count the women who appear to have heights of 63 inches or less by looking at the table. They are in the oval. d. Are the answers to parts b and c the same or different? Explain.
Solution Summary: The author calculates the percentage of women who have heights of 63.5 inches or less and shaded the region in the sketch of the normal curve.
Women's Heights Assume for this question that college women's heights are approximately Normally distributed with a mean of 64.6 inches and a standard deviation of 2.6 inches. Draw a well-labeled Normal curve for each part.
a. Find the percentage of women who should have heights of 63.5 inches or less.
b. In a sample of 123 women, according to the probability obtained in part a, how many should have heights of 63.5 inches or less?
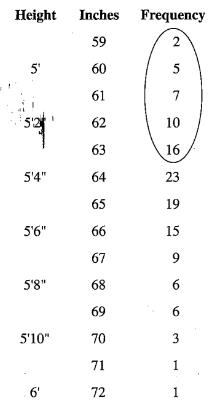
c. The table shows the frequencies of heights for a sample of women, collected by statistician Brian Joiner in his statistics class. Count the women who appear to have heights of 63 inches or less by looking at the table. They are in the oval.
d. Are the answers to parts b and c the same or different? Explain.
Research Methods for the Behavioral Sciences (MindTap Course List)
Knowledge Booster
Learn more about
Need a deep-dive on the concept behind this application? Look no further. Learn more about this topic, statistics and related others by exploring similar questions and additional content below.
Continuous Probability Distributions - Basic Introduction; Author: The Organic Chemistry Tutor;https://www.youtube.com/watch?v=QxqxdQ_g2uw;License: Standard YouTube License, CC-BY
Probability Density Function (p.d.f.) Finding k (Part 1) | ExamSolutions; Author: ExamSolutions;https://www.youtube.com/watch?v=RsuS2ehsTDM;License: Standard YouTube License, CC-BY
Find the value of k so that the Function is a Probability Density Function; Author: The Math Sorcerer;https://www.youtube.com/watch?v=QqoCZWrVnbA;License: Standard Youtube License


 Glencoe Algebra 1, Student Edition, 9780079039897...AlgebraISBN:9780079039897Author:CarterPublisher:McGraw Hill