EBK PRINCIPLES OF OPERATIONS MANAGEMENT
10th Edition
ISBN: 8220102744059
Author: HEIZER
Publisher: PEARSON
expand_more
expand_more
format_list_bulleted
Concept explainers
Videos
Textbook Question
Chapter 6, Problem 5P
Kathleen McFadden’s restaurant in Boston has recorded the following data for eight recent customers:
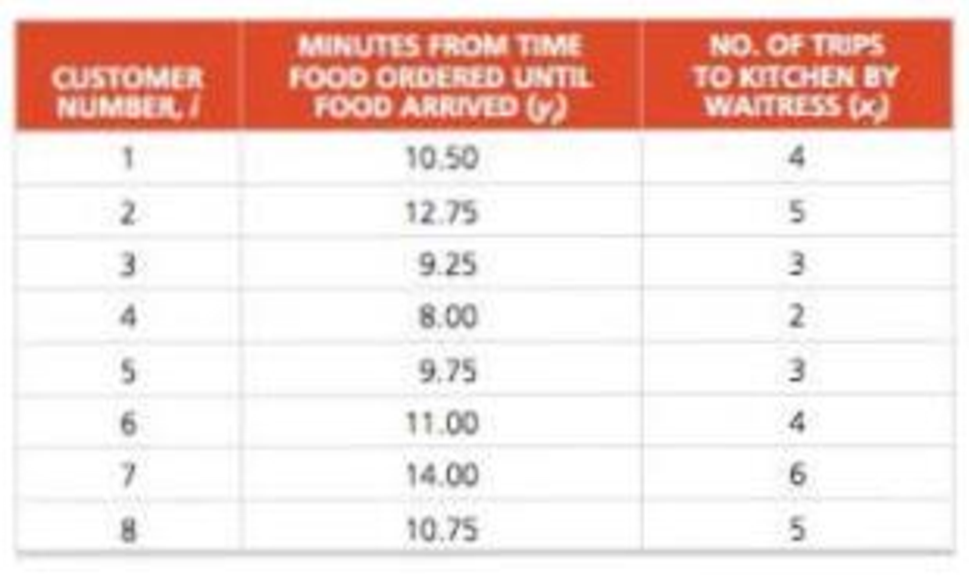
a) McFadden wants you to graph the eight points (x, y), i = 1. 2, ... 8. She has been concerned because customers have been waiting too long for their food, and this graph is intended to help her find possible causes of the problem.
b) This H an example of what type of graph?
Expert Solution & Answer
Want to see the full answer?
Check out a sample textbook solution
Students have asked these similar questions
Mrs. Alaa works on developing staff training programs in Al Bustan Hotel to improve the services provided by the hotel She
has been working their since 1990 and she mainly uses customers feedback on social media & customer complaints to
forecast future training needs. The method used by Mrs. Alaa is
a. Delphi
b. Judgmental
C Associative models
d. Time series
An avant-garde clothing manufacturer runs a series of high-profile, risque ads on a billboard on Highway 101 and regularly collects protest calls from people who
are offended by them. The company has no idea how many people in total see the ad, but it has been collecting statistics on the number of phone calls from
irate viewers:
a) Choose the correct Pareto chart below.
O A.
Frequency (number)
LL
WROMI
O
B.
Frequency (number)
Type
R
M
W
I
O
Description
Offensive racially/ethnically
Demeaning to men
Demeaning to women
Ad is Incomprehensible
Other
RMWO
Frequency (number)
LONDO
Number of
Complaints
12
4
13
2
7
WROMI
O
Frequency (number)
OFONSO
12-
RM WIO
South Africa Airways would like to monitor its airline’s performance. Each week for the past 20 weeks, they checked each week a random sample of 100 flight arrivals for “one-time” performance. The table that follows contains the number of flights that did not meet South Africa Airways definition of “one time”:
Week
Late flights
1
2
2
4
3
10
4
4
5
1
6
1
7
13
8
9
9
11
10
0
11
3
12
4
13
2
14
2
15
8
16
2
17
3
18
7
19
3
20
2
Calculate the upper and lower control limits for this chart.
Chapter 6 Solutions
EBK PRINCIPLES OF OPERATIONS MANAGEMENT
Ch. 6.S - Prob. 1DQCh. 6.S - Define in statistical control.Ch. 6.S - Prob. 3DQCh. 6.S - Prob. 4DQCh. 6.S - Prob. 5DQCh. 6.S - Prob. 6DQCh. 6.S - Prob. 7DQCh. 6.S - Prob. 8DQCh. 6.S - Prob. 9DQCh. 6.S - Prob. 10DQ
Ch. 6.S - Prob. 11DQCh. 6.S - Prob. 12DQCh. 6.S - Prob. 13DQCh. 6.S - Prob. 14DQCh. 6.S - Prob. 15DQCh. 6.S - Prob. 16DQCh. 6.S - Prob. 17DQCh. 6.S - Prob. 18DQCh. 6.S - Prob. 19DQCh. 6.S - Prob. 1PCh. 6.S - Prob. 2PCh. 6.S - Prob. 3PCh. 6.S - Prob. 4PCh. 6.S - Prob. 5PCh. 6.S - Prob. 6PCh. 6.S - Prob. 7PCh. 6.S - Prob. 8PCh. 6.S - Prob. 9PCh. 6.S - Prob. 10PCh. 6.S - Prob. 11PCh. 6.S - Prob. 12PCh. 6.S - Prob. 13PCh. 6.S - Prob. 14PCh. 6.S - Prob. 15PCh. 6.S - Prob. 16PCh. 6.S - Prob. 17PCh. 6.S - Prob. 18PCh. 6.S - Prob. 19PCh. 6.S - Prob. 20PCh. 6.S - Prob. 21PCh. 6.S - Prob. 22PCh. 6.S - Prob. 23PCh. 6.S - Prob. 24PCh. 6.S - Prob. 25PCh. 6.S - Prob. 26PCh. 6.S - Prob. 27PCh. 6.S - Prob. 40PCh. 6.S - Prob. 41PCh. 6.S - Prob. 42PCh. 6.S - Prob. 43PCh. 6.S - Prob. 44PCh. 6.S - Prob. 45PCh. 6.S - Prob. 51PCh. 6.S - Prob. 52PCh. 6.S - Prob. 53PCh. 6.S - Prob. 54PCh. 6.S - Prob. 55PCh. 6.S - Prob. 1CSCh. 6.S - Prob. 2CSCh. 6.S - Prob. 1.1VCCh. 6.S - Prob. 1.2VCCh. 6.S - Prob. 1.3VCCh. 6.S - Prob. 2.1VCCh. 6.S - Select two potential problems-one in the Darden...Ch. 6.S - Prob. 2.3VCCh. 6.S - Prob. 2.4VCCh. 6 - Prob. 1EDCh. 6 - Prob. 1DQCh. 6 - Prob. 2DQCh. 6 - Prob. 3DQCh. 6 - Prob. 4DQCh. 6 - Prob. 5DQCh. 6 - Prob. 6DQCh. 6 - Prob. 7DQCh. 6 - Prob. 8DQCh. 6 - Prob. 9DQCh. 6 - Prob. 10DQCh. 6 - Prob. 11DQCh. 6 - Prob. 12DQCh. 6 - Prob. 13DQCh. 6 - Prob. 14DQCh. 6 - Prob. 15DQCh. 6 - Prob. 16DQCh. 6 - Prob. 17DQCh. 6 - Prob. 18DQCh. 6 - An avant-garde clothing manufacturer runs a series...Ch. 6 - Prob. 2PCh. 6 - Prob. 3PCh. 6 - Prob. 4PCh. 6 - Kathleen McFaddens restaurant in Boston has...Ch. 6 - Prob. 6PCh. 6 - Prob. 7PCh. 6 - Prob. 8PCh. 6 - Prob. 9PCh. 6 - Prob. 10PCh. 6 - Prob. 11PCh. 6 - Prob. 12PCh. 6 - Prob. 13PCh. 6 - Prob. 14PCh. 6 - Prob. 15PCh. 6 - Prob. 16PCh. 6 - Prob. 17PCh. 6 - Prob. 1CSCh. 6 - Prob. 2CSCh. 6 - Prob. 3CSCh. 6 - Prob. 1.1VCCh. 6 - Prob. 1.2VCCh. 6 - Prob. 1.3VCCh. 6 - Prob. 1.4VCCh. 6 - Prob. 2.1VCCh. 6 - Prob. 2.2VCCh. 6 - Prob. 2.3VCCh. 6 - Prob. 2.4VCCh. 6 - Prob. 3.1VCCh. 6 - Prob. 3.2VCCh. 6 - Prob. 3.3VCCh. 6 - Prob. 3.4VCCh. 6 - Prob. 3.5VC
Knowledge Booster


Learn more about
Need a deep-dive on the concept behind this application? Look no further. Learn more about this topic, operations-management and related others by exploring similar questions and additional content below.Similar questions
- At the beginning of each week, a machine is in one of four conditions: 1 = excellent; 2 = good; 3 = average; 4 = bad. The weekly revenue earned by a machine in state 1, 2, 3, or 4 is 100, 90, 50, or 10, respectively. After observing the condition of the machine at the beginning of the week, the company has the option, for a cost of 200, of instantaneously replacing the machine with an excellent machine. The quality of the machine deteriorates over time, as shown in the file P10 41.xlsx. Four maintenance policies are under consideration: Policy 1: Never replace a machine. Policy 2: Immediately replace a bad machine. Policy 3: Immediately replace a bad or average machine. Policy 4: Immediately replace a bad, average, or good machine. Simulate each of these policies for 50 weeks (using at least 250 iterations each) to determine the policy that maximizes expected weekly profit. Assume that the machine at the beginning of week 1 is excellent.arrow_forwardSouth Africa Airways would like to monitor its airline’s performance. Each week for the past 20 weeks, they checked each week a random sample of 100 flight arrivals for “one-time” performance. The table that follows contains the number of flights that did not meet South Africa Airways definition of “one time”: Week Late flights 1 2 2 4 3 10 4 4 5 1 6 1 7 13 8 9 9 11 10 0 11 3 12 4 13 2 14 2 15 8 16 2 17 3 18 7 19 3 20 2 Which control chart is appropriate to analyze the above data? Justify your answerarrow_forwardThe following data was recorded while observing the increase in the number of butterflies in two different ponds, Pond A and Pond B. Number of Butterflies Present Over 5 Years Year Pond A Pond B 0 50 65 85 1 2 3 4 5 100 O 110 121 133 146 161 110 143 186 What is the rate of growth, r, for each pond and which pond has the fastest average rate of growth over the five years? TA = 1.1, TB = 1.3, mg = 3.72 butterflies/yr TA=0.9, TB=0.8, mg = 3.72 butterflies/yr TA=0.9, TB=0.8, mg=27.2 butterflies/yr TA = 1.1, TB = 1.3, mg=27.2 butterflies/yrarrow_forward
- Figure shows summer air visibility measurements for Denver, Colorado. The acceptable visibility standard is 100, with readings above 100 indicating clean air and good visibility, and readings below 100 indicating temperature inversions caused by forest fires, volcanic eruptions, or collisions with comets.a. Is a trend evident in the data? Which time-series techniques might be appropriate for estimating the average of these data?b. A medical center for asthma and respiratory diseases located in Denver has great demand for its services when air quality is poor. If you were in charge of developing a short-term (say, 3-day) forecast of visibility, which causal factor(s) would you analyze? In other words, which external factors hold the potential to significantly affect visibility in the short term?c. Tourism, an important factor in Denver’s economy, is affected by the city’s image. Air quality, as measured by visibility, affects the city’s image. If you were responsible for development of…arrow_forward6. List and explain in detail why we include disturbance term or error term in the model?arrow_forwardEstimating a cost function, high-low method. Lacy Dallas is examining customer-service costs in the southern region of Camilla Products. Camilla Products has more than 200 separate electrical products that are sold with a 6-month guarantee of full repair or replacement with a new product. When a product is returned by a customer, a service report is prepared. This service report includes details of the problem and the time and cost of resolving the problem. Weekly data for the most recent 8-week period are as follows: Plot the relationship between customer-service costs and number of service reports. Is the relationship economically plausible? Use the high-low method to compute the cost function relating customer-service costs to the number of service reports. What variables, in addition to number of service reports, might be cost drivers of weekly customer-service costs of Camilla Products?arrow_forward
- Study B: The decoy effect is the phenomenon that an additional but worse option can boost the appeal of an existing option. In order to get workers at food-processing factories in China to comply with hygiene standards (i.e., using hand sanitizer every hour), researchers manipulated whether there were additional options to the standard and convenient spray bottle provided to each employee. Workers in different rooms were randomly assigned to have just the standard spray bottle, or the standard spray bottle and an inconvenient squeeze bottle. Quality control personnel kept track of hand sanitizer use (weighing the bottles before and after each shift) and sanitary condition (sample wipes assessing the number of bacteria on hands). Neither the employees or quality control personnel were aware of the experiment or its hypothesis. The researchers found that when a decoy was present, workers used more sanitizer and were more likely to pass hand sanitary tests. In this example, it was…arrow_forwardRecords pertaining to the monthly number of job-related injuries at an underground coal mine were being studied by a government agency. The values for the past 100 months were as follows: Injuries Frequency of per Month Occurrence 32 40 2 15 3 4 1. 1. Apply the chi-square test to these data to test the hypothesis that the underlying distribution is Poisson. Important note: In the answer box below, just put the numerical test statistic value. Use x.xx format for the numerical value you provide as the answer. Do NOT compare the test statistic with the critical value from a table. Answer:arrow_forwardTucson Machinery, Inc., manufactures numerically controlled machines, which sell for an average price of $14.0 million each. Sales for these NCMs for the past two years were as follows: Use Exhibit 3.10. QUARTER LAST YEAR I II III IV QUANTITY (UNITS) Y = 14 20 28 18 QUARTER THIS YEAR I II III IV QUANTITY (UNITS) 20 26 30 15 a. Find the equation of a simple linear regression line using Excel. (Round your answers to 3 decimal places.) > Answer is complete but not entirely correct. 18.535 X + 0.630 tarrow_forward
- Mr. Ferdinand is a well known entrepreneur who sells fresh organic beef to persons in the localcommunity. Customers love the quality of meet that Mr. Ferdinand sells so they tend torecommend his product to other persons. Recently, Mr. Ferdinand has been running out of beefto sell to his customers. One customer suggests to him that he must use past sales records toforecast demand for his beef so that he can meet his customers demand. 1. Using a numerical example, demonstrate to Mr. Ferdinand how he can use a three-week and a four-week weighted moving average to forecast demand for his beef.arrow_forwardThe materials handling manager of a manufacturing company is trying to forecast the cost of maintenance for the company's fleet of over-the-road tractors. The manager believes that the cost of maintaining the tractors increases with their age. The following data was collected: Yearly Maintenance Yearly Maintenance Age (years) Age (years) Cost ($) Cost (S) 6.5 819 8.0 1,394 5.5 1,249 2.5 363 6.5 1,233 2.5 382 7.0 695 9.0 964 6.0 923 8.0 1,573 6.0 881 3.0 1,178 7.0 1,090 3.0 666 7.0 1,722 3.0 749 7.5 1,187 a. Use POM for Windows' least squares-linear regression module to develop a relationship to forecast the yearly maintenance cost based on the age of a tractor. (Enter your responses rounded to three decimal places and include a minus sign if necessary.) Y = 365.727 + 110,721 X where Y = Yearly maintenance cost in dollars and X= Age in years. b. If a section has 20 four-year-old tractors, what is the forecast for the annual maintenance cost? $ |- (Enter your response rounded to two…arrow_forwardProblem 1: Auto pistons at Wemming Chung’s plant in Shanghai are produced in a forging process, and the diameter is a critical factor that must be controlled. From sample sizes of 10 pistons produced each day, the mean and the range of this diameter have been as follows: Day Mean (mm) Range (mm) 1 156.9 4.2 2 153.2 4.6 3 153.6 4.1 4 155.5 5.0 5 156.6 4.5 a) What are the UCL x (line on top of x, counldn't find the button to do it) and LCL x (line on top of x) , using 3σ? Plot the data. b) What are the UCL R and LCL R , using 3σ? Plot the data. c) Is the Process in Control? (Please screen shot the EXCEl if its in excel) Note:- Do not provide handwritten solution. Maintain accuracy and quality in your answer. Take care of plagiarism. Answer completely. You will get up vote for sure.arrow_forward
arrow_back_ios
arrow_forward_ios
Recommended textbooks for you
 Practical Management ScienceOperations ManagementISBN:9781337406659Author:WINSTON, Wayne L.Publisher:Cengage,
Practical Management Science
Operations Management
ISBN:9781337406659
Author:WINSTON, Wayne L.
Publisher:Cengage,
Introduction to Forecasting; Author: Ekeeda;https://www.youtube.com/watch?v=5eIbVXrJL7k;License: Standard YouTube License, CC-BY