
Concept explainers
Videos
Refer to the Real Estate data, which report information on homes sold in the Goodyear, Arizona, area last year.
- a. Create a
probability distribution for the number of bedrooms. Compute themean and the standard deviation of this distribution. - b. Create a probability distribution for the number of bathrooms. Compute the mean and the standard deviation of this distribution.
a.
Construct the probability distribution for the number of bedrooms.
Calculate the mean and standard deviation of this distribution.
Answer to Problem 70DE
The probability distribution for the number of bedrooms is as follows:
| Number of Bedrooms | Frequency |
Probability |
| 2 | 24 | 0.2286 |
| 3 | 26 | 0.2476 |
| 4 | 26 | 0.2476 |
| 5 | 11 | 0.1048 |
| 6 | 14 | 0.1333 |
| 7 | 2 | 0.0190 |
| 8 | 2 | 0.0190 |
| Total | 105 | 1 |
The mean of the distribution is 3.8.
The standard deviation of the distribution is 1.4954.
Explanation of Solution
Step-by-step procedure to obtain the frequency table for the number of bedrooms using EXCEL is given below:
- Enter the data in an EXCEL sheet.
- Go to Insert > PivotTable > PivotTable.
- In Table/Range, select the column Bedrooms and click OK.
- In PivotTable Field List, drag Bedrooms to Row Labels and to ∑ values.
- Click on it from ∑ values.
- Choose Value Field Settings.
- In Summarize value field by, choose Count and click OK.
The output obtained is as follows:
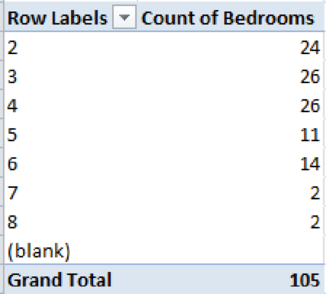
The probability distributions for the number of bedrooms are calculated as follows:
| Number of Bedrooms | Frequency |
Probability |
| 2 | 24 | |
| 3 | 26 | |
| 4 | 26 | |
| 5 | 11 | |
| 6 | 14 | |
| 7 | 2 | |
| 8 | 2 | |
| Total | 105 | 1 |
The mean of the distribution is calculated as follows:
Therefore, the mean of the distribution is 3.8.
Consider the following table that shows preliminary calculations to compute the standard deviation:
| Bedrooms | Frequency |
Probability | ||
| 2 | 24 | 0.2286 | ||
| 3 | 26 | 0.2476 | ||
| 4 | 26 | 0.2476 | ||
| 5 | 11 | 0.1048 | ||
| 6 | 14 | 0.1333 | ||
| 7 | 2 | 0.0190 | ||
| 8 | 2 | 0.0190 | ||
| 105 | 2.2362 |
The standard deviation of the distribution is calculated as follows:
Therefore, the standard deviation of the distribution is 1.4954.
b.
Construct the probability distribution for the number of bathrooms.
Find the mean and standard deviation for this distribution.
Answer to Problem 70DE
The probability distributions for the number of bathrooms are as follows:
| Number of Bathrooms | Frequency |
Probability |
| 1.5 | 16 | 0.1524 |
| 2 | 65 | 0.6191 |
| 2.5 | 15 | 0.1429 |
| 3 | 9 | 0.0857 |
| 105 |
The mean of the distribution is 2.0812.
The standard deviation of the distribution is 0.3912.
Explanation of Solution
Step-by-step procedure to obtain the frequency table for bedrooms using EXCEL:
- Enter the data in an EXCEL sheet.
- Go to Insert > PivotTable > PivotTable.
- In Table/Range, select the column Bathrooms and click OK.
- In PivotTable Field List, drag Bathrooms to Row Labels and to ∑ values.
- Click on it from ∑ values.
- Choose Value Field Settings.
- In Summarize value field by, choose Count and click OK.
The output obtained is as follows:
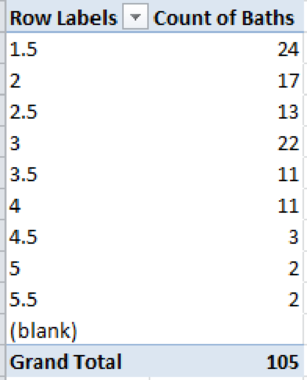
The probability distributions for the number of bathrooms are calculated as follows:
| Number of Bathrooms | Frequency |
Probability |
| 1.5 | 16 | |
| 2 | 65 | |
| 2.5 | 15 | |
| 3 | 9 | |
| Total | 105 | 1 |
The mean of the distribution is calculated as follows:
Therefore, the mean of the distribution is 2.0812.
Consider the following table that shows preliminary calculations to compute the standard deviation:
| Number of Bathrooms | Frequency |
Probability | ||
| 1.5 | 16 | 0.1524 | ||
| 2 | 65 | 0.6191 | ||
| 2.5 | 15 | 0.1429 | ||
| 3 | 9 | 0.0857 | ||
| Total | 105 |
The standard deviation of the distribution is calculated as follows:
Therefore, the standard deviation of the distribution is 0.3912.
Want to see more full solutions like this?
Chapter 6 Solutions
Statistical Techniques in Business and Economics, 16th Edition


 Glencoe Algebra 1, Student Edition, 9780079039897...AlgebraISBN:9780079039897Author:CarterPublisher:McGraw Hill
 Big Ideas Math A Bridge To Success Algebra 1: Stu...AlgebraISBN:9781680331141Author:HOUGHTON MIFFLIN HARCOURTPublisher:Houghton Mifflin Harcourt