
Concept explainers
Videos
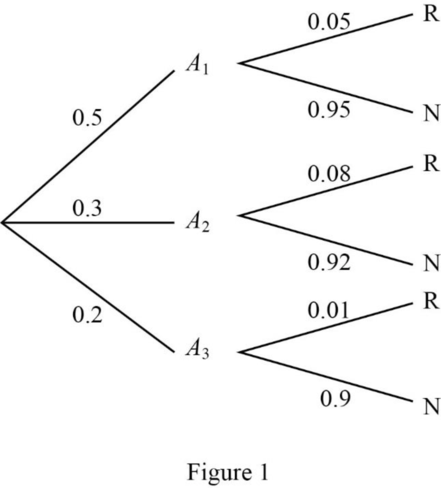
A company uses three different assembly lines—A1, A2 and A3—to manufacture a particular component. Of those manufactured by A1, 5% need rework to remedy a defect, whereas 8% of A2’s components and 10% of A3’s components need rework. Suppose that 50% of all components are produced by A1, 30% are produced by A2 and 20% are produced by A3.
- a. Construct a tree diagram with first-generation branches corresponding to the three lines. Leading from each branch, draw one branch for rework (R) and another for no rework (N). Then enter appropriate probabilities on the branches.
- b. What is the
probability that a randomly selected component came from A1 and needed rework? - c. What is the probability that a randomly selected component needed rework?
a.
Draw a tree diagram with first-generation branches corresponds to the three lines.
Answer to Problem 87CR
The tree diagram with first-generation branches corresponds to the three lines is:

Explanation of Solution
Calculation:
The given information is that about 50% of component manufactured by
Here, the probability of component manufactured by
The probability of component manufactured by
The probability of component manufactured by
The probability of component manufactured by
The probability of component manufactured by
The probability of component manufactured by
Tree diagram:
Tree diagram is a graphical representation of sample points. From a tree diagram, one can easily identify the sample points and number of sample points in the sample space.
The following tree diagram represents the given situation:
b.
Compute the probability that a randomly selected component came from
Answer to Problem 87CR
The probability that a randomly selected component came from
Explanation of Solution
Calculation:
The probability that a randomly selected component came from
Thus, the probability that a randomly selected component came from
c.
Find the probability that a randomly selected component need rework.
Answer to Problem 87CR
The probability that a randomly selected component need rework is 0.069.
Explanation of Solution
Calculation:
The probability that a randomly selected component need rework is calculated as follows:
Thus, the probability that a randomly selected component need rework is 0.069.
Want to see more full solutions like this?
Chapter 6 Solutions
Introduction to Statistics and Data Analysis


- A sampled injection-molded part could have been produced in either one of two presses and in any one of the eight cavities in each press. Use tree diagram.arrow_forwardThe figure to the right shows the results of a survey in which 1012 adults from Country A, 1009 adults from Country B, 1016 adults from Country C, 1010 adults from Country D, and 1005 adults from Country E were asked whether national identity is strongly tied to birthplace. A table labeled "National Identity and Birthplace, People from different countries who believe national identity is strongly tied to birthplace" consists of five rows containing the following information from top to bottom, with row listed first and information listed second: Country A, 31 percent; Country B, 20 percent; Country C, 25 percent; Country D, 53 percent; Country E, 12 percent.Country A31%20%25%53%Country BCountry CCountry DCountry E12% Construct a 99% confidence interval for the population proportion of adults who say national identity is strongly tied to birthplace for each country listed.arrow_forwardConsider the following tree Descendent of e, r and n Siblings of d, c, and u Ancestor of s, c and aarrow_forward
- Create a tree diagram to show all the possible outcomes for one spin of the spinner and one roll of the dicearrow_forwardGiven the following fictitious data 40% of all undergraduates at XYZ University are from Florida and60% from out of state. 22% are freshmen, and 78% are not. Out of all freshmen, 36% are from Florida,and 64% from out of state. Determine the probability a randomly selected XYZ University undergraduate:Suggestion: Make a tree diagram with the first branches being freshmen or not.a) is from Florida and a freshman. b) is from Florida and not a freshman.c) is from out of state and not a freshman. d) is a freshman given the student is from Florida.arrow_forwardA shop stocks 2 brands of tinned food A and B. Each brand has 2 sizes, large and small.The total stock contains 70% of brand A and 30% of brand B. For the tins of brand A, 30%are small size whilst brand B, 40 % are large size. Using a tree diagram, find the probabilitythat:i. A tin chosen at random from the stock will be Brand A and of a small size.ii. A tin chosen at random from the stock will be Brand B and of a large sizearrow_forward
- In a study of the domestic market share of the three major automobile manufacturers A, B, and C in a certain country, it was found that their current market shares were 65%, 10%, and 25%, respectively. Furthermore, it was found that of the customers who bought a car manufactured by A, 75% would again buy a car manufactured by A, 15% would buy a car manufactured by B, and 10% would buy a car manufactured by C. Of the customers who bought a car manufactured by B, 90% would again buy a car manufactured by B, whereas 5% each would buy cars manufactured by A and C. Finally, of the customers who bought a car manufactured by C, 85% would again buy a car manufactured by C, 5% would buy a car manufactured by A, and 10% would buy a car manufactured by B. Assuming that these sentiments reflect the buying habits of customers in the future, determine the market share that will be held by each manufacturer after the next two model years. (Round your answers to the nearest percent.)arrow_forwardSuppose that in a baseball World Series (in which thewinner is the first team to win four games) the NationalLeague champion leads the American League championthree games to two. Construct a tree diagram to show thenumber of ways in which these teams may win or lose theremaining game or games.arrow_forwardIn a study of the domestic market share of the three major automobile manufacturers A, B, and C in a certain country, it was found that their current market shares were 45%, 20%, and 35%, respectively. Furthermore, it was found that of the customers who bought a car manufactured by A, 75% would again buy a car manufactured by A, 15% would buy a car manufactured by B, and 10% would buy a car manufactured by C. Of the customers who bought a car manufactured by B, 90% would again buy a car manufactured by B, whereas 5% each would buy cars manufactured by A and C. Finally, of the customers who bought a car manufactured by C, 85% would again buy a car manufactured by C, 5% would buy a car manufactured by A, and 10% would buy a car manufactured by B. Assuming that these sentiments reflect the buying habits of customers in the future, determine the market share that will be held by each manufacturer after the next two model years. (Round your answers to the nearest percent.) A % B…arrow_forward
- In a study of the domestic market share of three major automobile manufacturers A, B and C in a certain country, it was found out that of the customers who bought a car manufactured by A, 75% would again buy a car manufactured by A, 15% would buy a car manufactured by B and the rest wouldbuyacarmanufacturedbyC.OfthecustomerswhoboughtacarmanufacturedbyB,90% would again buy a car manufactured by B, 5% would buy a car manufactured by A and the rest would buy a car manufactured by C. Of the customers who bought a car manufactured by C, 85% would again buy a car manufactured by C, 5% would buy a car manufactured by A and the rest would buy a car manufactured by B. Required Justify the long run market share of the manufacturersarrow_forwardThe U.S. Department of Transportation reported that during November, 83.4% of Southwest Airlines' flights, 75.1% of US Airways' flights, and 70.1% of JetBlue's flights arrived on time (USA Today, January 4, 2007). Assume that this on - time performance is applicable for flights arriving at concourse A of the Rochester International Airport, and that 40% of the arrivals at concourse A are Southwest Airlines flights, 35% are US Airways flights, and 25% are JetBlue flights. An announcement has just been made that Flight 1424 will be arriving at gate 20 in concourse A. What is the most likely airline for this arrival? What is the probability that Flight 1424 will arrive on time? Suppose that an announcement is made saying that Flight 1424 will be arriving late. What is the most likely airline for this arrival? What is the least likely airline? Develop a joint probability table with three rows (airlines) and two columns (on-time arrivals vs. late arrivals). What is the highest probability…arrow_forwardThe U.S. Department of Transportation reported that during November, 83.4% of Southwest Airlines' flights, 75.1% of US Airways' flights, and 70.1% of JetBlue's flights arrived on time (USA Today, January 4, 2007). Assume that this on - time performance is applicable for flights arriving at concourse A of the Rochester International Airport, and that 40% of the arrivals at concourse A are Southwest Airlines flights, 35% are US Airways flights, and 25% are JetBlue flights a)Suppose that an announcement is made saying that Flight 1424 will be arriving late. What is the most likely airline for this arrival? What is the least likely airline? b)Develop a joint probability table with three rows (airlines) and two columns (on-time arrivals vs. late arrivals). What is the highest probability and the lowest? c)An announcement has just been made that Flight 1424 will be arriving at gate 20 in concourse A. What is the most likely airline for this arrival? d)What is the probability that Flight…arrow_forward
 MATLAB: An Introduction with ApplicationsStatisticsISBN:9781119256830Author:Amos GilatPublisher:John Wiley & Sons Inc
 Probability and Statistics for Engineering and th...StatisticsISBN:9781305251809Author:Jay L. DevorePublisher:Cengage Learning
 Statistics for The Behavioral Sciences (MindTap C...StatisticsISBN:9781305504912Author:Frederick J Gravetter, Larry B. WallnauPublisher:Cengage Learning
 Elementary Statistics: Picturing the World (7th E...StatisticsISBN:9780134683416Author:Ron Larson, Betsy FarberPublisher:PEARSON
 The Basic Practice of StatisticsStatisticsISBN:9781319042578Author:David S. Moore, William I. Notz, Michael A. FlignerPublisher:W. H. Freeman
 Introduction to the Practice of StatisticsStatisticsISBN:9781319013387Author:David S. Moore, George P. McCabe, Bruce A. CraigPublisher:W. H. Freeman