
EP ELEMENTARY STATISTICS-MYLAB STAT.ACC
13th Edition
ISBN: 9780134464404
Author: Triola
Publisher: PEARSON CO
expand_more
expand_more
format_list_bulleted
Concept explainers
Videos
Textbook Question
Chapter 6.1, Problem 12BSC
Standard
12.
Expert Solution & Answer

Learn your wayIncludes step-by-step video

schedule02:04
Students have asked these similar questions
Constructing Normal Quantile Plots. In Exercises 17–20, use the given data values to identify the corresponding z scores that are used for a normal quantile plot, then identify the coordinates of each point in the normal quantile plot. Construct the normal quantile plot, then determine whether the data appear to be from a population with a normal distribution.
Brain Volumes A sample of human brain volumes (cm3) is obtained from those listed in Data Set 8 “IQ and Brain Size” in Appendix B: 1027, 1029, 1034, 1070, 1079, 1079, 963, 1439.
IQ scores form a normal distribution with u=100 and σ=15. Individuals with IQs between 90 and 110 are classified as average. What proportion of the population is average?
Scores on the Math Achievement Test form a normal distribution with a mean of μ = 300 and σ = 100. A school distributes scholarships to students who score in the top 10% for this test. What score or higher must be earned to score in the top 10% on the Math Achievement Test?
Chapter 6 Solutions
EP ELEMENTARY STATISTICS-MYLAB STAT.ACC
Ch. 6.1 - Normal Distribution Whats wrong with the following...Ch. 6.1 - Normal Distribution A normal distribution is...Ch. 6.1 - Standard Normal Distribution Identify the two...Ch. 6.1 - Notation What does the notation z indicate?Ch. 6.1 - Continuous Uniform Distribution. In Exercises 58,...Ch. 6.1 - Continuous Uniform Distribution. In Exercises 58,...Ch. 6.1 - Continuous Uniform Distribution. In Exercises 58,...Ch. 6.1 - Continuous Uniform Distribution. In Exercises 58,...Ch. 6.1 - Standard Normal Distribution. In Exercises 912,...Ch. 6.1 - Standard Normal Distribution. In Exercises 912,...
Ch. 6.1 - Standard Normal Distribution. In Exercises 912,...Ch. 6.1 - Standard Normal Distribution. In Exercises 912,...Ch. 6.1 - Standard Normal Distribution. In Exercises 1316,...Ch. 6.1 - Standard Normal Distribution. In Exercises 1316,...Ch. 6.1 - Standard Normal Distribution. In Exercises 1316,...Ch. 6.1 - Standard Normal Distribution. In Exercises 1316,...Ch. 6.1 - Standard Normal Distribution. In Exercises 1736,...Ch. 6.1 - Standard Normal Distribution. In Exercises 1736,...Ch. 6.1 - Standard Normal Distribution. In Exercises 1736,...Ch. 6.1 - Standard Normal Distribution. In Exercises 1736,...Ch. 6.1 - Standard Normal Distribution. In Exercises 1736,...Ch. 6.1 - Standard Normal Distribution. In Exercises 1736,...Ch. 6.1 - Standard Normal Distribution. In Exercises 1736,...Ch. 6.1 - Standard Normal Distribution. In Exercises 1736,...Ch. 6.1 - Standard Normal Distribution. In Exercises 1736,...Ch. 6.1 - Standard Normal Distribution. In Exercises 1736,...Ch. 6.1 - Standard Normal Distribution. In Exercises 1736,...Ch. 6.1 - Standard Normal Distribution. In Exercises 1736,...Ch. 6.1 - Standard Normal Distribution. In Exercises 1736,...Ch. 6.1 - Standard Normal Distribution. In Exercises 1736,...Ch. 6.1 - Standard Normal Distribution. In Exercises 1736,...Ch. 6.1 - Standard Normal Distribution. In Exercises 1736,...Ch. 6.1 - Standard Normal Distribution. In Exercises 1736,...Ch. 6.1 - Standard Normal Distribution. In Exercises 1736,...Ch. 6.1 - Standard Normal Distribution. In Exercises 1736,...Ch. 6.1 - Standard Normal Distribution. In Exercises 1736,...Ch. 6.1 - Finding Bone Density Scores. In Exercises 3740...Ch. 6.1 - Finding Bone Density Scores. In Exercises 3740...Ch. 6.1 - Finding Bone Density Scores. In Exercises 3740...Ch. 6.1 - Finding Bone Density Scores. In Exercises 3740...Ch. 6.1 - Critical Values. In Exercises 4144, find the...Ch. 6.1 - Critical Values. In Exercises 4144, find the...Ch. 6.1 - Critical Values. In Exercises 4144, find the...Ch. 6.1 - Critical Values. In Exercises 4144, find the...Ch. 6.1 - Basis for the Range Rule of Thumb and the...Ch. 6.1 - Basis for the Range Rule of Thumb and the...Ch. 6.1 - Basis for the Range Rule of Thumb and the...Ch. 6.1 - Basis for the Range Rule of Thumb and the...Ch. 6.1 - Significance For bone density scores that are...Ch. 6.1 - Distributions In a continuous uniform...Ch. 6.2 - Birth Weights Based on Data Set 4 Births in...Ch. 6.2 - Birth Weights Based on Data Set 4 Births in...Ch. 6.2 - Normal Distributions What is the difference...Ch. 6.2 - Random Digits Computers are commonly used to...Ch. 6.2 - IQ Scores. In Exercises 58, find the area of the...Ch. 6.2 - IQ Scores. In Exercises 58, find the area of the...Ch. 6.2 - IQ Scores. In Exercises 58, find the area of the...Ch. 6.2 - IQ Scores. In Exercises 58, find the area of the...Ch. 6.2 - IQ Scores. In Exercises 912, find the indicated IQ...Ch. 6.2 - IQ Scores. In Exercises 912, find the indicated IQ...Ch. 6.2 - IQ Scores. In Exercises 912, find the indicated IQ...Ch. 6.2 - IQ Scores. In Exercises 912, find the indicated IQ...Ch. 6.2 - Seat Designs. In Exercises 1320, use the data in...Ch. 6.2 - Seat Designs. In Exercises 1320, use the data in...Ch. 6.2 - Seat Designs. In Exercises 1320, use the data in...Ch. 6.2 - Seat Designs. In Exercises 1320, use the data in...Ch. 6.2 - Seat Designs. In Exercises 1320, use the data in...Ch. 6.2 - Seat Designs. In Exercises 1320, use the data in...Ch. 6.2 - Seat Designs. In Exercises 1320, use the data in...Ch. 6.2 - Seat Designs. In Exercises 1320, use the data in...Ch. 6.2 - In Exercises 2124, use these parameters (based on...Ch. 6.2 - In Exercises 2124, use these parameters (based on...Ch. 6.2 - In Exercises 2124, use these parameters (based on...Ch. 6.2 - In Exercises 2124, use these parameters (based on...Ch. 6.2 - Eye Contact In a study of facial behavior, people...Ch. 6.2 - Designing a Work Station A common design...Ch. 6.2 - Jet Ejection Seats The U.S. Air Force once used...Ch. 6.2 - Quarters After 1964, quarters were manufactured so...Ch. 6.2 - Low Birth Weight The University of Maryland...Ch. 6.2 - Body Temperatures Based on the sample results in...Ch. 6.2 - Durations of Pregnancies The lengths of...Ch. 6.2 - Water Taxi Safety When a water taxi sank in...Ch. 6.2 - Large Data Sets. In Exercises 33 and 34, refer to...Ch. 6.2 - Large Data Sets. In Exercises 33 and 34, refer to...Ch. 6.2 - Curving Test Scores A professor gives a test and...Ch. 6.2 - Outliers For the purposes of constructing modified...Ch. 6.3 - Births There are about 11,000 births each day in...Ch. 6.3 - Sampling with Replacement The Orangetown Medical...Ch. 6.3 - Unbiased Estimators Data Set 4 Births in Appendix...Ch. 6.3 - Sampling Distribution Data Set 4 Births in...Ch. 6.3 - Good Sample? A geneticist is investigating the...Ch. 6.3 - College Presidents There are about 4200 college...Ch. 6.3 - In Exercises 710, use the same population of {4,...Ch. 6.3 - In Exercises 710, use the same population of {4,...Ch. 6.3 - In Exercises 710, use the same population of {4,...Ch. 6.3 - In Exercises 710, use the same population of {4,...Ch. 6.3 - In Exercises 1114, use the population of {34, 36,...Ch. 6.3 - In Exercises 1114, use the population of {34, 36,...Ch. 6.3 - In Exercises 1114, use the population of {34, 36,...Ch. 6.3 - In Exercises 1114, use the population of {34, 36,...Ch. 6.3 - Births: Sampling Distribution of Sample Proportion...Ch. 6.3 - Births: Sampling Distribution of Sample Proportion...Ch. 6.3 - SAT and ACT Tests Because they enable efficient...Ch. 6.3 - Hybridization A hybridization experiment begins...Ch. 6.3 - Using a Formula to Describe a Sampling...Ch. 6.3 - Mean Absolute Deviation Is the mean absolute...Ch. 6.4 - Requirements A researcher collects a simple random...Ch. 6.4 - Small Sample Weights of golden retriever dogs are...Ch. 6.4 - Notation In general, what do the symbols x and x...Ch. 6.4 - Annual Incomes Annual incomes are known to have a...Ch. 6.4 - Using the Central Limit Theorem. In Exercises 58,...Ch. 6.4 - Using the Central Limit Theorem. In Exercises 58,...Ch. 6.4 - Using the Central Limit Theorem. In Exercises 58,...Ch. 6.4 - Using the Central Limit Theorem. In Exercises 58,...Ch. 6.4 - Elevator Safety Example 2 referred to an elevator...Ch. 6.4 - Elevator Safety Exercise 9 uses = 189 lb, which...Ch. 6.4 - Mensa Membership in Mensa requires a score in the...Ch. 6.4 - Designing Manholes According to the website...Ch. 6.4 - Water Taxi Safety Passengers died when a water...Ch. 6.4 - Vending Machines Quarters are now manufactured so...Ch. 6.4 - Southwest Airlines Seats Southwest Airlines...Ch. 6.4 - Coke Cans Assume that cans of Coke are filled so...Ch. 6.4 - Redesign of Ejection Seats When women were finally...Ch. 6.4 - Loading a Tour Boat The Ethan Allen tour boat...Ch. 6.4 - Doorway Height The Boeing 757-200 ER airliner...Ch. 6.4 - Loading Aircraft Before every flight, the pilot...Ch. 6.4 - Correcting for a Finite Population In a study of...Ch. 6.5 - Normal Quantile Plot Data Set 1 Body Data in...Ch. 6.5 - Normal Quantile Plot After constructing a...Ch. 6.5 - Small Sample Data set 29 Coin Weights in Appendix...Ch. 6.5 - Assessing Normality The accompanying histogram is...Ch. 6.5 - Prob. 5BSCCh. 6.5 - Prob. 6BSCCh. 6.5 - Prob. 7BSCCh. 6.5 - Interpreting Normal Quantile Plots. In Exercises...Ch. 6.5 - Prob. 9BSCCh. 6.5 - Determining Normality. In Exercises 912, refer to...Ch. 6.5 - Determining Normality. In Exercises 912, refer to...Ch. 6.5 - Prob. 12BSCCh. 6.5 - Using Technology to Generate Normal Quantile...Ch. 6.5 - Using Technology to Generate Normal Quantile...Ch. 6.5 - Prob. 15BSCCh. 6.5 - Prob. 16BSCCh. 6.5 - Constructing Normal Quantile Plots. In Exercises...Ch. 6.5 - Prob. 18BSCCh. 6.5 - Constructing Normal Quantile Plots. In Exercises...Ch. 6.5 - Constructing Normal Quantile Plots. In Exercises...Ch. 6.5 - Transformations The heights (in inches) of men...Ch. 6.5 - Lognormal Distribution The following are the...Ch. 6.6 - Continuity Correction In testing the assumption...Ch. 6.6 - Checking Requirements Common tests such as the...Ch. 6.6 - Notation Common tests such as the SAT, ACT, LSAT,...Ch. 6.6 - Distribution of Proportions Each week, Nielsen...Ch. 6.6 - Using Normal Approximation. In Exercises 58, do...Ch. 6.6 - Using Normal Approximation. In Exercises 58, do...Ch. 6.6 - Using Normal Approximation. In Exercises 58, do...Ch. 6.6 - Using Normal Approximation. In Exercises 58, do...Ch. 6.6 - Car Colors. In Exercises 912, assume that 100 cars...Ch. 6.6 - Car Colors. In Exercises 912, assume that 100 cars...Ch. 6.6 - Car Colors. In Exercises 912, assume that 100 cars...Ch. 6.6 - Car Colors. In Exercises 912, assume that 100 cars...Ch. 6.6 - Tennis Replay In the year that this exercise was...Ch. 6.6 - Tennis Replay Repeat the preceding exercise after...Ch. 6.6 - Smartphones Based on an LG smartphone survey,...Ch. 6.6 - Eye Color Based on a study by Dr. P. Sorita at...Ch. 6.6 - Mendelian Genetics When Mendel conducted his...Ch. 6.6 - Sleepwalking Assume that 29.2% of people have...Ch. 6.6 - Voters Lying? In a survey of 1002 people, 701 said...Ch. 6.6 - Cell Phones and Brain Cancer In a study of 420,095...Ch. 6.6 - Births The probability of a baby being born a boy...Ch. 6.6 - Overbooking a Boeing 767-300 A Boeing 767-300...Ch. 6 - Bone Density Test. In Exercises 14, assume that...Ch. 6 - Bone Density Test. In Exercises 14, assume that...Ch. 6 - Bone Density Test. In Exercises 14, assume that...Ch. 6 - Bone Density Test. In Exercises 14, assume that...Ch. 6 - Notation a. Identify the values of and for the...Ch. 6 - In Exercises 610, assume that women have diastolic...Ch. 6 - In Exercises 610, assume that women have diastolic...Ch. 6 - In Exercises 610, assume that women have diastolic...Ch. 6 - In Exercises 610, assume that women have diastolic...Ch. 6 - In Exercises 610, assume that women have diastolic...Ch. 6 - Bone Density Test A bone mineral density test is...Ch. 6 - Biometric Security In designing a security system...Ch. 6 - Biometric Security Standing eye heights of men are...Ch. 6 - Sampling Distributions Scores on the Gilliam...Ch. 6 - Unbiased Estimators a. What is an unbiased...Ch. 6 - Disney Monorail The Mark VI monorail used at...Ch. 6 - Disney Monorail Consider the same Mark VI monorail...Ch. 6 - Assessing Normality Listed below are the recent...Ch. 6 - Hybridization Experiment In one of Mendels...Ch. 6 - Tall Clubs The social organization Tall Clubs...Ch. 6 - In Exercises 13, use the following recent annual...Ch. 6 - In Exercises 13, use the following recent annual...Ch. 6 - In Exercises 13, use the following recent annual...Ch. 6 - Blue Eyes Assume that 35% of us have blue eyes...Ch. 6 - Foot Lengths of Women Assume that foot lengths of...Ch. 6 - Assessing Normality It is often necessary to...Ch. 6 - Binomial Probabilities Section 6-6 described a...
Additional Math Textbook Solutions
Find more solutions based on key concepts
29. Putting It Together: Online Homework Keeping students engaged in the learning process greatly increases the...
Fundamentals of Statistics (5th Edition)
Find how many SDs above the mean price would be predicted to cost.
Intro Stats, Books a la Carte Edition (5th Edition)
The standard normal curve associated with which normal distribution.
Introductory Statistics (10th Edition)
10 40 A random sample of 250 observations was classified according to the row and column categories shown in th...
Statistics for Business and Economics (13th Edition)
Description and inference a. Distinguish between description and inference as reasons for using statistics. Ill...
Statistics: The Art and Science of Learning from Data (4th Edition)
Knowledge Booster


Learn more about
Need a deep-dive on the concept behind this application? Look no further. Learn more about this topic, statistics and related others by exploring similar questions and additional content below.Similar questions
- IQ Scores. In Exercises 5–8, find the area of the shaded region. The graphs depict IQ scores of adults, and those scores are normally distributed with a mean of 100 and a stan- dard deviation of 15 (as on the Wechsler IQ test). 5. 6. 118 91 7. 8. 79 133 112 124arrow_forwardIQ test scores are standardized to produce a normal distribution with a mean of μ = 100 and a standard deviation of σ =15. Find the proportion of the population in each of the following IQ categories. Genius or near genius: IQ over 140 Very superior intelligence: IQ from 120–140 Average or normal intelligence: IQ from 90–109arrow_forwardIQ Scores. In Exercises,find the area of the shaded region. The graphs depict IQ scores of adults, and those scores are normally distributed with a mean of 100 and a standard deviation of 15 (as on the Wechsler test).arrow_forward
- Monthly maintenance costs are distributed normally with a µ = $250 and σ =$50. Find the range around the mean that includes 99.7% of the cost.arrow_forwardIQ Scores. In Exercises, find the area of the shaded region. The graphs depict IQ scores of adults, and those scores are normally distributed with a mean of 100 and a standard deviation of 15 (as on the Wechsler test).arrow_forwardUsing Technology to Generate Normal Quantile Plots. In Exercises 13–16, use the data from the indicated exercise in this section. Use software (such as Statdisk, Minitab, Excel, or StatCrunch) or a TI-83/84 Plus calculator to generate a normal quantile plot. Then determine whether the data come from a normally distributed population. Exercise 10 “Ages of Best Actresses”arrow_forward
- Pls help ASAParrow_forwardMacmillan Learning Dr. Caras was characterizing a cytochrome (an iron containing protein) from a new strain of bacteria. He obtained eight measurements of the percent iron in the protein: 0.5708%, 0.5701%, 0.5692%, 0.5692%, 0.5811%, 0.5695%, 0.5708%, and 0.5698%. Calculate the mean (x) and standard deviation (s) for these results. x = S= Use the Grubbs test to determine if one of these values is an outlier. What is the value of Gcalculated? Gcalculated = % %arrow_forwardUsing the z-table, determine the z-score that has 15% of the area to the right of itarrow_forward
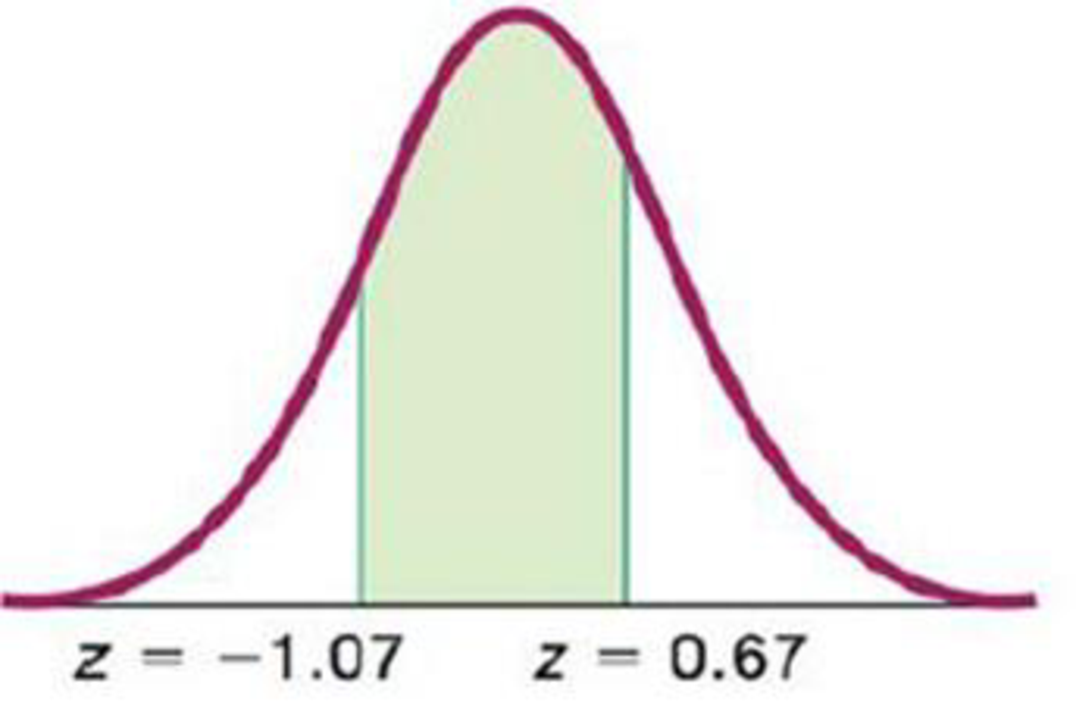
- Fill out the tablearrow_forwardFind the z-score that has 1.7% of the distribution area to its left.arrow_forwardStandard Normal Distribution. In Exercises find the area of the shaded region. The graph depicts the standard normal distribution of bone density scores with mean 0 and standard deviation 1.arrow_forward
arrow_back_ios
SEE MORE QUESTIONS
arrow_forward_ios
Recommended textbooks for you
 Big Ideas Math A Bridge To Success Algebra 1: Stu...AlgebraISBN:9781680331141Author:HOUGHTON MIFFLIN HARCOURTPublisher:Houghton Mifflin Harcourt
Big Ideas Math A Bridge To Success Algebra 1: Stu...
Algebra
ISBN:9781680331141
Author:HOUGHTON MIFFLIN HARCOURT
Publisher:Houghton Mifflin Harcourt
Continuous Probability Distributions - Basic Introduction; Author: The Organic Chemistry Tutor;https://www.youtube.com/watch?v=QxqxdQ_g2uw;License: Standard YouTube License, CC-BY
Probability Density Function (p.d.f.) Finding k (Part 1) | ExamSolutions; Author: ExamSolutions;https://www.youtube.com/watch?v=RsuS2ehsTDM;License: Standard YouTube License, CC-BY
Find the value of k so that the Function is a Probability Density Function; Author: The Math Sorcerer;https://www.youtube.com/watch?v=QqoCZWrVnbA;License: Standard Youtube License