Concept explainers
Videos
Continuous Uniform Distribution. In Exercises 5–8, refer to the continuous uniform distribution depicted in Figure 6-2 and described in Example 1. Assume that a passenger is randomly selected, and find the probability that the waiting time is within the given
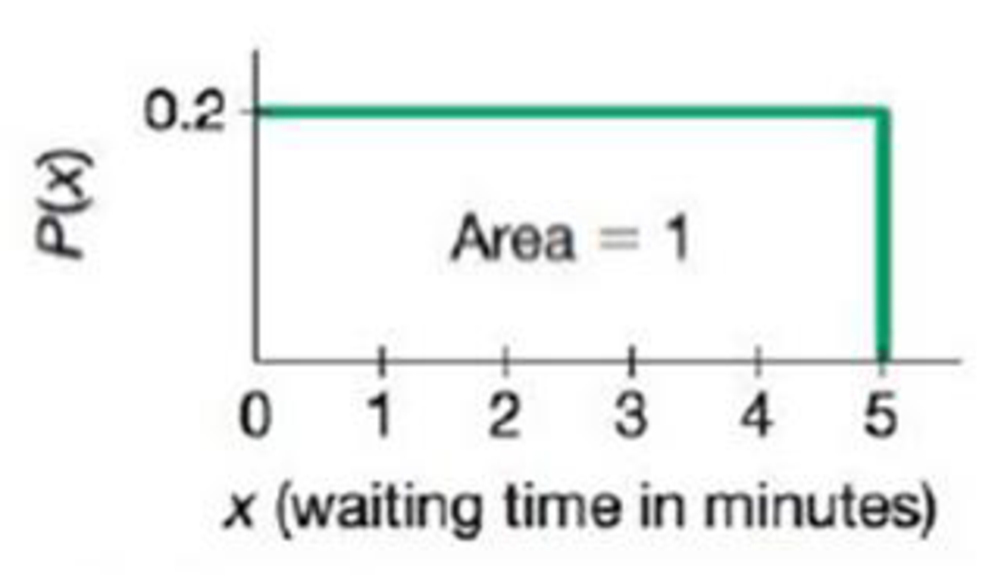
FIGURE 6-2
5. Greater than 3.00 minutes

Learn your wayIncludes step-by-step video

Chapter 6 Solutions
MyLab Statistics with Pearson eText -- Standalone Access Card -- for Essentials of Statistics
Additional Math Textbook Solutions
Fundamentals of Statistics (5th Edition)
Introductory Statistics (2nd Edition)
Essentials of Statistics, Books a la Carte Edition (5th Edition)
Basic Business Statistics, Student Value Edition (13th Edition)
Elementary Statistics: Picturing the World (6th Edition)
Statistics: The Art and Science of Learning from Data (4th Edition)


- Probability Lecture.arrow_forwardChapter 6, Section 2-D, Exercise 071 Assume the sample is a random sample from a distribution that is reasonably normally distributed and we are doing inference for a sample mean. Find the area in a t-distribution above 2.3 if the sample has size n=6.Round your answer to three decimal places.area = Enter your answer in accordance to the question statementarrow_forwardCalls arrive at a switchboard with a mean of one every 11 seconds. What is the exponential probability that it will take more than 21 seconds for the next call to arrive?arrow_forward
- Assume that the amount of time until a kid gets bored and wants to leave a playground can be modeled using exponential distribution. Given that 5 kids leave a particular playground on average per hour, if a kid has already played 10 minutes there what is the probability he will have spent at least a total of 25 minutes before he leaves? OA. 0.2865 OB. 0,7135 OC 0.8755 OD.0.1245arrow_forwardAssume that the amount of time until a kid gets bored and wants to leave a playground can be modeled using exponential distribution. Given that 5 kids leave a particular playground on average per hour, if a kid has already played 10 minutes there what is the probability he will have spent at least a total of 25 minutes before he leaves? OA. 0.1245 OB. 0.7135 OC. 0.8755 OD. 0.2865arrow_forwardCalculate the relative frequency P(E). You roll two dice 10 times. Both dice show the same number 2 times, and on 3 rolls, exactly one number is odd. E is the event that the sum of the numbers is even. P(E) =arrow_forward
- Using the Central Limit Theorem. In Exercises 5–8, assume that females have pulse rates that are normally distributed with a mean of 74.0 beats per minute and a standard deviation of 12.5 beats per minute (based on Data Set 1 “Body Data” in Appendix B). a. If 1 adult female is randomly selected, find the probability that her pulse rate is greater than 70 beats per minute. b. If 25 adult females are randomly selected, find the probability that they have pulse rates with a mean greater than 70 beats per minute. c. Why can the normal distribution be used in part (b), even though the sample size does not exceed 30?arrow_forwardnt: Chapter 5 Assignment Exercise 05.08 Algo (Developing Discrete Probability Distributions) x 1 2 The following data were collected by counting the number of operating rooms in use at Tampa General Hospital over a 20-day period: On three of the days only one operating room was used, on five of the days two were used, on eight of the days three were used, and on four days all four of the hospital's operating rooms were used. Round your answers to two decimal places. a. Use the relative frequency approach to construct an empirical discrete probability distribution for the number of operating rooms in use on any given day. 3 4 f(x) ***** Total b. Select a graph of the probability distribution. 3111 Save hp Assignment Score: 90.35% Submit Assignment for Grading Question 8 of 10 ► Hint(s) Check My Work Sep 17 11:3arrow_forwardplease solve the following The manager of the emergency room (ER) at a large hospital is to count the number of patients arriving at the ER to receive medical attention, per hour. He randomly picks 11 one-hour time intervals, and counts the number of people arriving to receive medical attention in each of these 11 one-hour time intervals.He notices that this count fluctuates from one-hour to the next.Identify the probability model that best models such fluctuations.A. Uniform distributionB. Hypergeometric distributionC. Binomial distributionD. Random distributionE. Poisson distributionF. Bernoulli distributionG. none of the above A lottery consists of picking 5 numbers from 1 to 50, the winner of this lottery has to match all numbers chosen. That is, his/her 5 numbers have to match the 5 numbers taken from 1 to 50.A player of this lottery is to count how many of his/her numbers match the winning 5-number combination.Identify the probability model that best models this count.A.…arrow_forward
- Exhibit 5-1The following represents the probability distribution for the daily demand of microcomputers at a local store. Demand Probability 0 .1 1 .2 2 .3 3 .2 4 .2 Refer to Exhibit 5-1. The probability of having a demand for at least two microcomputers is _____.arrow_forwardCalls arrive at a switchboard a mean of one every 39 seconds. What is the exponential probability that it will take more than 29 seconds but less than 34 seconds for the next call to arrive?arrow_forwardPart 1: 1-1. X1, X2, ... is a random sample of N (H, a?), find the distribution of Y = (n-1)s²arrow_forward
 Algebra & Trigonometry with Analytic GeometryAlgebraISBN:9781133382119Author:SwokowskiPublisher:Cengage