
Concept explainers
Videos
40. California Lottery Mega Numbers. The histogram in Figure 6.9 shows the distribution of “Mega” numbers (possible values
a. Assuming the lottery drawings are random, what would you expect the probability of any Mega number to be?
b. Based on the histogram, what Mega number occurred most often and what was its relative frequency?
c. What would the histogram in Figure 6.9 look like if it represented billions of Mega numbers instead of 1639?
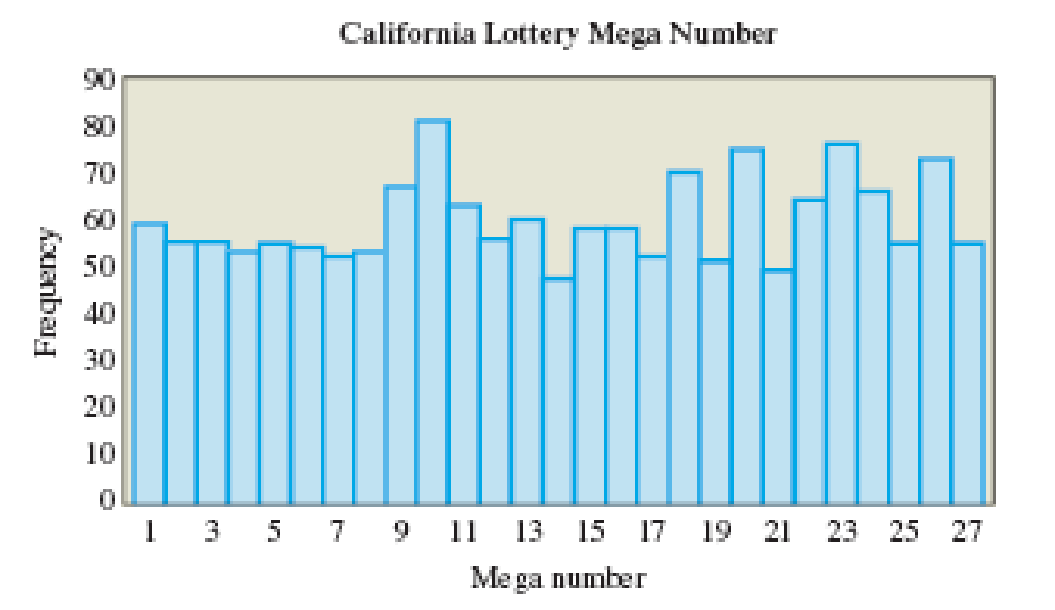
Figure 6.9
Want to see the full answer?
Check out a sample textbook solution
Chapter 6 Solutions
Statistical Reasoning for Everyday Life, Books a la Carte Edition, Plus NEW MyLab Statistics with Pearson eText -- Access Card Package (5th Edition)


- In Example 5, what is the probability that an institution selected at random is in the Pacific region?arrow_forwarda What is meant by an experiment? Sample space? b What is an event? c Define the probability of an event E in a sample space S in which all outcomes are equally likely. d What is the probability of the complement of E? e If a coin is tossed three times, what is the probability of getting all heads? At least one tail?arrow_forwardFlexible Work Hours In a recent survey, people were asked whether they would prefer to work flexible hours----even when it meant slower career advancement----so they could spend more time with their families. The figure shows the results of the survey. What is the probability that three people chosen at random would prefer flexible work hours?arrow_forward

 Algebra and Trigonometry (MindTap Course List)AlgebraISBN:9781305071742Author:James Stewart, Lothar Redlin, Saleem WatsonPublisher:Cengage Learning
 College AlgebraAlgebraISBN:9781305115545Author:James Stewart, Lothar Redlin, Saleem WatsonPublisher:Cengage Learning