
Videos
To show:
The data of company Alcoa and data of returns on S&P.
Explanation of Solution
The data for returns of Alcoa is shown below:
| Date | Returns Alcoa |
| 12/1/2013 | 0 |
| 1/1/2014 | 0 |
| 2/1/2014 | 0.019785587 |
| 3/1/2014 | 0.094520691 |
| 4/1/2014 | 0.045565745 |
| 5/1/2014 | 0.010340052 |
| 6/1/2014 | 0.09213958 |
| 7/1/2014 | 0.09598186 |
| 8/1/2014 | 0.013333413 |
| 9/1/2014 | -0.029980428 |
| 10/1/2014 | 0.040797065 |
| 11/1/2014 | 0.031133233 |
| 12/1/2014 | -0.088938172 |
| 1/1/2015 | -0.008906032 |
| 2/1/2015 | -0.056519624 |
| 3/1/2015 | -0.133367024 |
| 4/1/2015 | 0.037969704 |
| 5/1/2015 | -0.071017427 |
| 6/1/2015 | -0.112097041 |
| 7/1/2015 | -0.121939527 |
| 8/1/2015 | -0.043485446 |
| 9/1/2015 | 0.025067099 |
| 10/1/2015 | -0.078577301 |
| 11/1/2015 | 0.047029033 |
| 12/1/2015 | 0.056257819 |
| 1/1/2016 | -0.302996218 |
| 2/1/2016 | 0.202912827 |
| 3/1/2016 | 0.074574737 |
| 4/1/2016 | 0.153553957 |
| 5/1/2016 | -0.18644828 |
| 6/1/2016 | 0.002902807 |
| 7/1/2016 | 0.135955619 |
| 8/1/2016 | -0.052185714 |
| 9/1/2016 | 0.008845955 |
| 10/1/2016 | -0.12794767 |
| 11/1/2016 | 0.301002453 |
| 12/1/2016 | -0.027282474 |
| 1/1/2017 | 0.260883907 |
| 2/1/2017 | -0.052376863 |
| 3/1/2017 | -0.005508 |
| 4/1/2017 | -0.019668973 |
| 5/1/2017 | -0.023699955 |
| 6/1/2017 | -0.008842777 |
| 7/1/2017 | 0.108723913 |
| 8/1/2017 | 0.186889829 |
| 9/1/2017 | 0.060570954 |
| 10/1/2017 | 0.024577509 |
| 11/1/2017 | -0.121820059 |
| 12/1/2017 | 0.241786656 |
| 1/1/2018 | -0.034945458 |
| 2/1/2018 | -0.145632637 |
| 3/1/2018 | -0.00022244 |
| 4/1/2018 | 0.129966368 |
| 5/1/2018 | -0.06308127 |
| 6/1/2018 | -0.025067115 |
| 7/1/2018 | -0.080131612 |
| 8/1/2018 | 0.031842536 |
| 9/1/2018 | -0.100472256 |
| 10/1/2018 | -0.143767471 |
| 11/1/2018 | -0.095281689 |
| 12/1/2018 | -0.098711084 |
| 12/7/2018 | 0 |
To show:
The data of returns on S&P.
Explanation of Solution
The data for returns of S&P is shown below:
| Date | Returns S&P |
| 12/1/2013 | 0 |
| 1/1/2014 | 0 |
| 2/1/2014 | 0.042213375 |
| 3/1/2014 | 0.006908249 |
| 4/1/2014 | 0.006181643 |
| 5/1/2014 | 0.020812196 |
| 6/1/2014 | 0.018878997 |
| 7/1/2014 | -0.015194687 |
| 8/1/2014 | 0.036963644 |
| 9/1/2014 | -0.015635436 |
| 10/1/2014 | 0.022936399 |
| 11/1/2014 | 0.024237474 |
| 12/1/2014 | -0.004197385 |
| 1/1/2015 | -0.031532779 |
| 2/1/2015 | 0.053438876 |
| 3/1/2015 | -0.017549197 |
| 4/1/2015 | 0.008484722 |
| 5/1/2015 | 0.01043673 |
| 6/1/2015 | -0.021235559 |
| 7/1/2015 | 0.019549683 |
| 8/1/2015 | -0.064624731 |
| 9/1/2015 | -0.026798731 |
| 10/1/2015 | 0.079719379 |
| 11/1/2015 | 0.000504742 |
| 12/1/2015 | -0.017685659 |
| 1/1/2016 | -0.052067617 |
| 2/1/2016 | -0.004136906 |
| 3/1/2016 | 0.06390499 |
| 4/1/2016 | 0.002695762 |
| 5/1/2016 | 0.015208367 |
| 6/1/2016 | 0.000910506 |
| 7/1/2016 | 0.034990433 |
| 8/1/2016 | -0.001219987 |
| 9/1/2016 | -0.001235213 |
| 10/1/2016 | -0.019616837 |
| 11/1/2016 | 0.033603545 |
| 12/1/2016 | 0.018037111 |
| 1/1/2017 | 0.017726315 |
| 2/1/2017 | 0.036523001 |
| 3/1/2017 | -0.000389273 |
| 4/1/2017 | 0.009050132 |
| 5/1/2017 | 0.011509759 |
| 6/1/2017 | 0.004802226 |
| 7/1/2017 | 0.019164018 |
| 8/1/2017 | 0.000546284 |
| 9/1/2017 | 0.019119039 |
| 10/1/2017 | 0.02194556 |
| 11/1/2017 | 0.003713141 |
| 12/1/2017 | 0.033766015 |
| 1/1/2018 | 0.054657399 |
| 2/1/2018 | -0.039726108 |
| 3/1/2018 | -0.027252497 |
| 4/1/2018 | 0.002715086 |
| 5/1/2018 | 0.021378191 |
| 6/1/2018 | 0.004830749 |
| 7/1/2018 | 0.035387951 |
| 8/1/2018 | 0.029814315 |
| 9/1/2018 | 0.004285093 |
| 10/1/2018 | -0.071929346 |
| 11/1/2018 | 0.017701752 |
| 12/1/2018 | -0.047137951 |
| 12/7/2018 | 0 |
c
In this step we have to calculate the excess returns of the stock Alcoa and S&P separately.
c
Explanation of Solution
The excess returns can be calculated by =
Excess return = Return on stock − T bill rate
Here is the sheet in which we have calculaed the excess returns:
| Date | Returns Alcoa | Returns S&P | T-Bill rate | Excess Return on Alcoa | Excess Return on S&P |
| 12/1/2013 | 0 | 0 | 0.07 | -0.07 | -0.07 |
| 1/1/2014 | 0 | 0 | 0.07 | -0.07 | -0.07 |
| 2/1/2014 | 0.019785587 | 0.042213375 | 0.04 | -0.02 | 0.00 |
| 3/1/2014 | 0.094520691 | 0.006908249 | 0.05 | 0.04 | -0.04 |
| 4/1/2014 | 0.045565745 | 0.006181643 | 0.05 | 0.00 | -0.04 |
| 5/1/2014 | 0.010340052 | 0.020812196 | 0.03 | -0.02 | -0.01 |
| 6/1/2014 | 0.09213958 | 0.018878997 | 0.03 | 0.06 | -0.01 |
| 7/1/2014 | 0.09598186 | -0.015194687 | 0.04 | 0.06 | -0.06 |
| 8/1/2014 | 0.013333413 | 0.036963644 | 0.03 | -0.02 | 0.01 |
| 9/1/2014 | -0.029980428 | -0.015635436 | 0.03 | -0.06 | -0.05 |
| 10/1/2014 | 0.040797065 | 0.022936399 | 0.02 | 0.02 | 0.00 |
| 11/1/2014 | 0.031133233 | 0.024237474 | 0.02 | 0.01 | 0.00 |
| 12/1/2014 | -0.088938172 | -0.004197385 | 0.02 | -0.11 | -0.02 |
| 1/1/2015 | -0.008906032 | -0.031532779 | 0.03 | -0.04 | -0.06 |
| 2/1/2015 | -0.056519624 | 0.053438876 | 0.03 | -0.09 | 0.02 |
| 3/1/2015 | -0.133367024 | -0.017549197 | 0.02 | -0.15 | -0.04 |
| 4/1/2015 | 0.037969704 | 0.008484722 | 0.03 | 0.01 | -0.02 |
| 5/1/2015 | -0.071017427 | 0.01043673 | 0.02 | -0.09 | -0.01 |
| 6/1/2015 | -0.112097041 | -0.021235559 | 0.02 | -0.13 | -0.04 |
| 7/1/2015 | -0.121939527 | 0.019549683 | 0.02 | -0.14 | 0.00 |
| 8/1/2015 | -0.043485446 | -0.064624731 | 0.03 | -0.07 | -0.09 |
| 9/1/2015 | 0.025067099 | -0.026798731 | 0.07 | -0.04 | -0.10 |
| 10/1/2015 | -0.078577301 | 0.079719379 | 0.02 | -0.10 | 0.06 |
| 11/1/2015 | 0.047029033 | 0.000504742 | 0.02 | 0.03 | -0.02 |
| 12/1/2015 | 0.056257819 | -0.017685659 | 0.12 | -0.06 | -0.14 |
| 1/1/2016 | -0.302996218 | -0.052067617 | 0.23 | -0.53 | -0.28 |
| 2/1/2016 | 0.202912827 | -0.004136906 | 0.26 | -0.06 | -0.26 |
| 3/1/2016 | 0.074574737 | 0.06390499 | 0.31 | -0.24 | -0.25 |
| 4/1/2016 | 0.153553957 | 0.002695762 | 0.29 | -0.14 | -0.29 |
| 5/1/2016 | -0.18644828 | 0.015208367 | 0.23 | -0.42 | -0.21 |
| 6/1/2016 | 0.002902807 | 0.000910506 | 0.27 | -0.27 | -0.27 |
| 7/1/2016 | 0.135955619 | 0.034990433 | 0.27 | -0.13 | -0.24 |
| 8/1/2016 | -0.052185714 | -0.001219987 | 0.30 | -0.35 | -0.30 |
| 9/1/2016 | 0.008845955 | -0.001235213 | 0.30 | -0.29 | -0.30 |
| 10/1/2016 | -0.12794767 | -0.019616837 | 0.29 | -0.42 | -0.31 |
| 11/1/2016 | 0.301002453 | 0.033603545 | 0.33 | -0.03 | -0.30 |
| 12/1/2016 | -0.027282474 | 0.018037111 | 0.45 | -0.48 | -0.43 |
| 1/1/2017 | 0.260883907 | 0.017726315 | 0.51 | -0.25 | -0.49 |
| 2/1/2017 | -0.052376863 | 0.036523001 | 0.51 | -0.56 | -0.47 |
| 3/1/2017 | -0.005508 | -0.000389273 | 0.52 | -0.53 | -0.52 |
| 4/1/2017 | -0.019668973 | 0.009050132 | 0.74 | -0.76 | -0.73 |
| 5/1/2017 | -0.023699955 | 0.011509759 | 0.80 | -0.82 | -0.79 |
| 6/1/2017 | -0.008842777 | 0.004802226 | 0.89 | -0.90 | -0.89 |
| 7/1/2017 | 0.108723913 | 0.019164018 | 0.98 | -0.87 | -0.96 |
| 8/1/2017 | 0.186889829 | 0.000546284 | 1.07 | -0.88 | -1.07 |
| 9/1/2017 | 0.060570954 | 0.019119039 | 1.01 | -0.95 | -0.99 |
| 10/1/2017 | 0.024577509 | 0.02194556 | 1.03 | -1.01 | -1.01 |
| 11/1/2017 | -0.121820059 | 0.003713141 | 1.07 | -1.19 | -1.07 |
| 12/1/2017 | 0.241786656 | 0.033766015 | 1.23 | -0.99 | -1.20 |
| 1/1/2018 | -0.034945458 | 0.054657399 | 1.32 | -1.35 | -1.27 |
| 2/1/2018 | -0.145632637 | -0.039726108 | 1.41 | -1.56 | -1.45 |
| 3/1/2018 | -0.00022244 | -0.027252497 | 1.57 | -1.57 | -1.60 |
| 4/1/2018 | 0.129966368 | 0.002715086 | 1.70 | -1.57 | -1.70 |
| 5/1/2018 | -0.06308127 | 0.021378191 | 1.76 | -1.82 | -1.74 |
| 6/1/2018 | -0.025067115 | 0.004830749 | 1.86 | -1.89 | -1.86 |
| 7/1/2018 | -0.080131612 | 0.035387951 | 1.90 | -1.98 | -1.86 |
| 8/1/2018 | 0.031842536 | 0.029814315 | 1.96 | -1.93 | -1.93 |
| 9/1/2018 | -0.100472256 | 0.004285093 | 2.03 | -2.13 | -2.03 |
| 10/1/2018 | -0.143767471 | -0.071929346 | 2.13 | -2.27 | -2.20 |
| 11/1/2018 | -0.095281689 | 0.017701752 | 2.25 | -2.35 | -2.23 |
| 12/1/2018 | -0.098711084 | -0.047137951 | 2.25 | -2.35 | -2.30 |
| 12/7/2018 | 0 | 0 | 2.25 | -2.25 | -2.25 |
d
We have to plot excess Alcoa return over excess S&P return.
d
Explanation of Solution
We can use excel insert function to plot XY chart by selecting the data give above.
The plot will look like this.
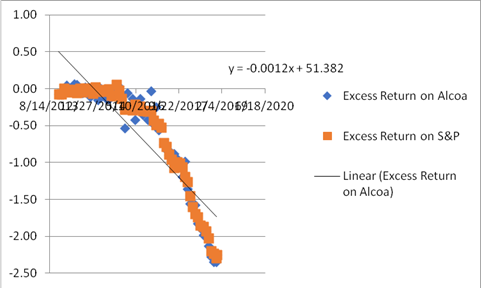
Then we can also insert the trend line.
e
We have to find out the beta and alpha of Alcoa by looking at the trend line.
e
Explanation of Solution
By looking at the trend line:
| Trend line is: | y = 0.0012 x + 51.382 | |
| Beta of Alcoa from the trend line = | 0.0012 | |
| And Alpha of Alcoa is : | 51.382 | |
Want to see more full solutions like this?
Chapter 7 Solutions
Essentials of Investments (The Mcgraw-hill/Irwin Series in Finance, Insurance, and Real Estate)


 Essentials Of InvestmentsFinanceISBN:9781260013924Author:Bodie, Zvi, Kane, Alex, MARCUS, Alan J.Publisher:Mcgraw-hill Education,

 Foundations Of FinanceFinanceISBN:9780134897264Author:KEOWN, Arthur J., Martin, John D., PETTY, J. WilliamPublisher:Pearson,
 Fundamentals of Financial Management (MindTap Cou...FinanceISBN:9781337395250Author:Eugene F. Brigham, Joel F. HoustonPublisher:Cengage Learning
 Corporate Finance (The Mcgraw-hill/Irwin Series i...FinanceISBN:9780077861759Author:Stephen A. Ross Franco Modigliani Professor of Financial Economics Professor, Randolph W Westerfield Robert R. Dockson Deans Chair in Bus. Admin., Jeffrey Jaffe, Bradford D Jordan ProfessorPublisher:McGraw-Hill Education