
Concept explainers
Videos
In this problem we have to get the data from yahoo finance for Alcoa and S&P 500 for 60 months and calculate their returns by using this formula:
Returns = ln(Return in current year/return in previous year)
Here ln stands for natural logarithm.
Explanation of Solution
The data is shown below:
| Date | Returns Alcoa | Returns S&P |
| 12/1/2013 | 0 | 0 |
| 1/1/2014 | 0 | 0 |
| 2/1/2014 | 0.019785587 | 0.042213375 |
| 3/1/2014 | 0.094520691 | 0.006908249 |
| 4/1/2014 | 0.045565745 | 0.006181643 |
| 5/1/2014 | 0.010340052 | 0.020812196 |
| 6/1/2014 | 0.09213958 | 0.018878997 |
| 7/1/2014 | 0.09598186 | -0.015194687 |
| 8/1/2014 | 0.013333413 | 0.036963644 |
| 9/1/2014 | -0.029980428 | -0.015635436 |
| 10/1/2014 | 0.040797065 | 0.022936399 |
| 11/1/2014 | 0.031133233 | 0.024237474 |
| 12/1/2014 | -0.088938172 | -0.004197385 |
| 1/1/2015 | -0.008906032 | -0.031532779 |
| 2/1/2015 | -0.056519624 | 0.053438876 |
| 3/1/2015 | -0.133367024 | -0.017549197 |
| 4/1/2015 | 0.037969704 | 0.008484722 |
| 5/1/2015 | -0.071017427 | 0.01043673 |
| 6/1/2015 | -0.112097041 | -0.021235559 |
| 7/1/2015 | -0.121939527 | 0.019549683 |
| 8/1/2015 | -0.043485446 | -0.064624731 |
| 9/1/2015 | 0.025067099 | -0.026798731 |
| 10/1/2015 | -0.078577301 | 0.079719379 |
| 11/1/2015 | 0.047029033 | 0.000504742 |
| 12/1/2015 | 0.056257819 | -0.017685659 |
| 1/1/2016 | -0.302996218 | -0.052067617 |
| 2/1/2016 | 0.202912827 | -0.004136906 |
| 3/1/2016 | 0.074574737 | 0.06390499 |
| 4/1/2016 | 0.153553957 | 0.002695762 |
| 5/1/2016 | -0.18644828 | 0.015208367 |
| 6/1/2016 | 0.002902807 | 0.000910506 |
| 7/1/2016 | 0.135955619 | 0.034990433 |
| 8/1/2016 | -0.052185714 | -0.001219987 |
| 9/1/2016 | 0.008845955 | -0.001235213 |
| 10/1/2016 | -0.12794767 | -0.019616837 |
| 11/1/2016 | 0.301002453 | 0.033603545 |
| 12/1/2016 | -0.027282474 | 0.018037111 |
| 1/1/2017 | 0.260883907 | 0.017726315 |
| 2/1/2017 | -0.052376863 | 0.036523001 |
| 3/1/2017 | -0.005508 | -0.000389273 |
| 4/1/2017 | -0.019668973 | 0.009050132 |
| 5/1/2017 | -0.023699955 | 0.011509759 |
| 6/1/2017 | -0.008842777 | 0.004802226 |
| 7/1/2017 | 0.108723913 | 0.019164018 |
| 8/1/2017 | 0.186889829 | 0.000546284 |
| 9/1/2017 | 0.060570954 | 0.019119039 |
| 10/1/2017 | 0.024577509 | 0.02194556 |
| 11/1/2017 | -0.121820059 | 0.003713141 |
| 12/1/2017 | 0.241786656 | 0.033766015 |
| 1/1/2018 | -0.034945458 | 0.054657399 |
| 2/1/2018 | -0.145632637 | -0.039726108 |
| 3/1/2018 | -0.00022244 | -0.027252497 |
| 4/1/2018 | 0.129966368 | 0.002715086 |
| 5/1/2018 | -0.06308127 | 0.021378191 |
| 6/1/2018 | -0.025067115 | 0.004830749 |
| 7/1/2018 | -0.080131612 | 0.035387951 |
| 8/1/2018 | 0.031842536 | 0.029814315 |
| 9/1/2018 | -0.100472256 | 0.004285093 |
| 10/1/2018 | -0.143767471 | -0.071929346 |
| 11/1/2018 | -0.095281689 | 0.017701752 |
| 12/1/2018 | -0.098711084 | -0.047137951 |
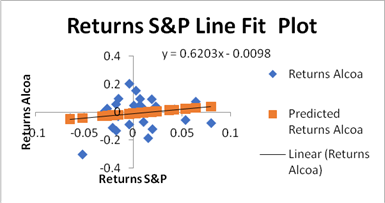
For First half of the data that is for 30 months, we run the regression between Alcoa and S&P to get this as an output.
Regression equation for the first 30 months is
Y = 0.6203X − 0.0098
From this equation the
Beta = slope of regression line = 0.6203
Alpha = intercept of regression line = 0.0098
For next half of the data that is for 30 months, we run the regression between Alcoa and S&P to get this as an output.
Regression equation for the first 30 months is
Y = 1.9944X − 0.0058
From this equation the
Beta = slope of regression line = 0.1.9944
Alpha = intercept of regression line = 0.0058
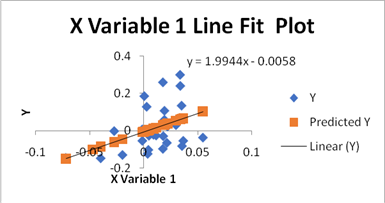
From this we can interpret that the for the first 30 months beta is quite lower as compared to the next 30 months. Also Alpha increased from negative 0.0098 to negative 0.0058 for the last 30 months meaning that the stock became more volatile and riskier and was giving more returns.
Want to see more full solutions like this?
Chapter 7 Solutions
Essentials Of Investments


 Essentials Of InvestmentsFinanceISBN:9781260013924Author:Bodie, Zvi, Kane, Alex, MARCUS, Alan J.Publisher:Mcgraw-hill Education,

 Foundations Of FinanceFinanceISBN:9780134897264Author:KEOWN, Arthur J., Martin, John D., PETTY, J. WilliamPublisher:Pearson,
 Fundamentals of Financial Management (MindTap Cou...FinanceISBN:9781337395250Author:Eugene F. Brigham, Joel F. HoustonPublisher:Cengage Learning
 Corporate Finance (The Mcgraw-hill/Irwin Series i...FinanceISBN:9780077861759Author:Stephen A. Ross Franco Modigliani Professor of Financial Economics Professor, Randolph W Westerfield Robert R. Dockson Deans Chair in Bus. Admin., Jeffrey Jaffe, Bradford D Jordan ProfessorPublisher:McGraw-Hill Education