
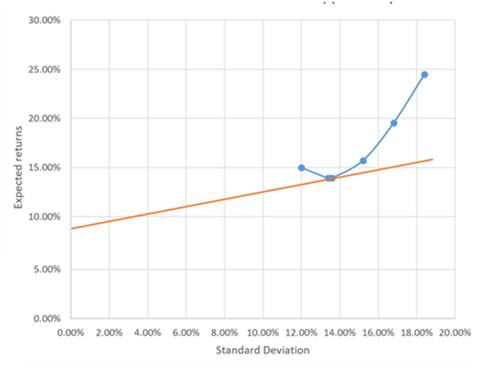
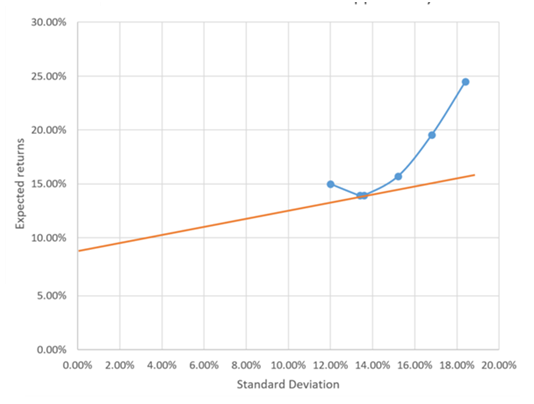
To calculate: The investment opportunity set of the two risky funds is to be tabulated along with the graph.
Introduction: The portfolio risk is defined as the combination of assets which carries its own risk with each investment.
The standard deviation is used to determine that in which manner the values from a data set vary from its mean value. This is calculated by the square root of the variance.
The expected return is defined as the return which is obtained on the risky asset that is expected in future.
Answer to Problem 5PS
Expected return for the portfolio = 13.39%
Standard deviation for the portfolio =
The graph is represented as −
Explanation of Solution
The following formula will be used to calculate the expected return of the portfolio for different proportions of stock and bond-
Where,
The following formula will be used to calculate the standard deviation of the portfolio for different proportions of stock and bond-
The three mutual funds are −
- Stock fund
- Long term government and corporate bond fund
- T-bill money market fund with yield 8%
The probability distribution of the risk fund is given as −
| Expected return | Standard deviation | |
| Stock fund (S) | 20% | 30% |
| Bond fund (B) | 12 | 15 |
The correlation between fund return = 0.10
The minimum variance portfolio is calculated as-
The weight of the stock fund in minimum variance portfolio is calculated as-
For bonds funds:
Put the calculated values in Equ (1) for expected return −
Put the calculated values in Equ (2) for the standard deviation-
The graph between expected return and standard deviation is called as investment opportunity set which is represented as −
Want to see more full solutions like this?
Chapter 7 Solutions
INVESTMENTS (LOOSELEAF) W/CONNECT

- Suppose that the return for a particular large-cap stock fund is normally distributed with a mean of 14.4% and standard deviation of 4.4%. a. What is the probability that the large-cap stock fund has a return of at least 20%? b. What is the probability that the large-cap stock fund has a return of 10% or less?arrow_forward[The following information applies to the questions displayed below.] A pension fund manager is considering three mutual funds. The first is a stock fund, the second is a long-term government and corporate bond fund, and the third is a T-bill money market fund that yields a sure rate of 4.5%. The probability distributions of the risky funds are: Expected Return Standard Deviation Stock fund (S) 15% 40% Bond fund (B) 9% 31% The correlation between the fund returns is 0.15. Required: What is the Sharpe ratio of the best feasible CAL? (Do not round intermediate calculations. Round your answer to 4 decimal places.)arrow_forwardA pension fund manager is considering three mutual funds. The first is a stock fund, the second is a long-term government and corporate bond fund, and the third is a T-bill money market fund that yields a rate of 5.4%. The probability distribution of the risky funds is as follows: Expected Return Standard Deviation Stock fund (S) 15% 44% Bond fund (B) 8 38 The correlation between the fund returns is 0.15.Solve numerically for the proportions of each asset and for the expected return and standard deviation of the optimal risky portfolio. (Do not round intermediate calculations and round your final answers to 2 decimal places. Omit the "%" sign in your response.)arrow_forward
- [The following information applies to the questions displayed below.] A pension fund manager is considering three mutual funds. The first is a stock fund, the second is a long-term government and corporate bond fund, and the third is a T-bill money market fund that yields a sure rate of 5.5%. The probability distributions of the risky funds are: Expected Return Standard Deviation Stock fund (S) 16% 40% Bond fund (B) 10% 31% The correlation between the fund returns is 0.11. Required: What is the Sharpe ratio of the best feasible CAL?arrow_forward[The following information applies to the questions displayed below.] A pension fund manager is considering three mutual funds. The first is a stock fund, the second is a long-term government and corporate bond fund, and the third is a T-bill money market fund that yields a sure rate of 5.5%. The probability distributions of the risky funds are: Expected Return Standard Deviation Stock fund (S) 16% 32% Bond fund (B) 10% 23% The correlation between the fund returns is 0.20 Required: What is the Sharpe ratio of the best feasible CAL? (Do not round intermediate calculations. Round your answer to 4 darrow_forwardA pension fund manager is considering three mutual funds. The first is a stock fund, the second is a long-term government and corporate bond fund, and the third is a T-bill money market fund that yields a rate of 8%. The probability distribution of the risky funds is as follows: Expected return Standard Deviation Stock fund 20% 30% Bond Fund 12 15 The correlation between the fund returns is 0.10. Tabulate the investment opportunity set of the two risky funds. (Round your answers to 2 decimal places.) Proportion in Stock fund Proportion in bond fund Expexted return Standard deviation 0% 100% 20% 80% 40% 60% 60% 40% 80% 20% 100% 0%arrow_forward
- A pension fund manager is considering three mutual funds. The first is a stock fund, the second is a long-term government and corporate bond fund, and the third is a T-bill money market fund that yields a rate of 6%. The probability distribution of the risky funds is as follows: E(r) st. dev. stock fund .24 .33 bond fund .14 .22 The correlation between the fund returns is 0.14. You require that your portfolio yield an expected return of 16%, and that it be efficient, on the best feasible CAL. a. What is the standard deviation of your portfolio? (Round your answer to 2 decimal places.) b. What is the proportion invested in the T-bill fund and each of the two risky funds? (Round your answers to 2 decimal places.)arrow_forwardA pension fund manager is considering three mutual funds. The first is a stock fund, the second is a long-term government and corporate bond fund, and the third is a T-bill money market fund that yields a rate of 8%. The probability distribution of the risky funds is as follows: Expected Return Standard Deviation Stock fund (s) 20% 30% Bond fund (b) 12 15 The correlation between the fund returns is .10. What are the investment proportions in the minimum-variance portfolio of the two risky funds, and what is the expected value and standard deviation of its rate of return?arrow_forwardThe following information applies to the questions displayed below A pension fund manager is considering three mutual funds. The first is a stock fund, the second is a long-term government and corporate bond fund, and the third is a T-bill money market fund that yields a sure rate of 5.5% The probability distributions of the risky funds are: Stock fund Bond fund Expected Return 17% 11 Standard Deviation 34% 25 The correlation between the fund returns is 0.15. Required: What is the Sharpe ratio of the best feasible CAL? (Do not round intermediate calculations. Round your answer to 4 decimal places.) Sharpe ratioarrow_forward
- A pension fund manager is considering three mutual funds. The first is a stock fund, the second is a long-term government and corporate bond fund, and the third is a T-bill money market fund that yields a sure rate of 4.5%. The probability distributions of the risky funds are: Expected Return Standard Deviation Stock fund (S) 15% 40% Bond fund (B) 9% 31% The correlation between the fund returns is 0.15. Required: Solve numerically for the proportions of each asset and for the expected return and standard deviation of the optimal risky portfolio. (Do not round intermediate calculations and round your final answers to 2 decimal places.)arrow_forwardA pension fund manager is considering three mutual funds. The first is a stock fund, the second is a long-term government and corporate bond fund, and the third is a T-bill money market fund that yields a sure rate of 5.5%. The probability distributions of the risky funds are: Expected Return Standard Deviation Stock fund (S) 17% 32% Bond fund (B) 11% 23% The correlation between the fund returns is 0.25. Required: Solve numerically for the proportions of each asset and for the expected return and standard deviation of the optimal risky portfolio. (Do not round intermediate calculations and round your final answers to 2 decimal places.) Portfolio Invested in Stock ____ % Portfolio Invested in the bond ____% Expected Return ____% Standard Deviation ___%arrow_forwardA pension fund manager is considering three mutual funds. The first is a stock fund, the second is a long-term government and corporate bond fund, and the third is a T-bill money market fund that yields a sure rate of 5.5%. The probability distribution of the risky funds is as follows: Expected Return Standard Deviation Stock fund (S) 16% 36% Bond fund (B) 10% 27% The correlation between the fund returns is 0.20 Solve numerically for the proportions of each asset and for the expected return and standard deviation of the optimal risky portfolio. (Do not round intermediate calculations and round your final answers to 2 decimal places. Omit the "%" sign in your response.) Portfolio invested in the stock % Portfolio invested in the bond % Expected return % Standard deviation %arrow_forward
 Pfin (with Mindtap, 1 Term Printed Access Card) (...FinanceISBN:9780357033609Author:Randall Billingsley, Lawrence J. Gitman, Michael D. JoehnkPublisher:Cengage Learning
 Essentials of Business Analytics (MindTap Course ...StatisticsISBN:9781305627734Author:Jeffrey D. Camm, James J. Cochran, Michael J. Fry, Jeffrey W. Ohlmann, David R. AndersonPublisher:Cengage Learning
 EBK CONTEMPORARY FINANCIAL MANAGEMENTFinanceISBN:9781337514835Author:MOYERPublisher:CENGAGE LEARNING - CONSIGNMENT
 Intermediate Financial Management (MindTap Course...FinanceISBN:9781337395083Author:Eugene F. Brigham, Phillip R. DavesPublisher:Cengage Learning