
Elementary Statistics Books a la carte Plus NEW MyLab Statistics with Pearson eText - Access Card Package (6th Edition)
6th Edition
ISBN: 9780133876239
Author: Ron Larson, Betsy Farber
Publisher: PEARSON
expand_more
expand_more
format_list_bulleted
Concept explainers
Videos
Textbook Question
Chapter 7.1, Problem 18E
Graphical Analysis In Exercises 17–20, match the alternative hypothesis with its graph. Then state the null hypothesis and sketch its graph.
18. Ha: μ < 3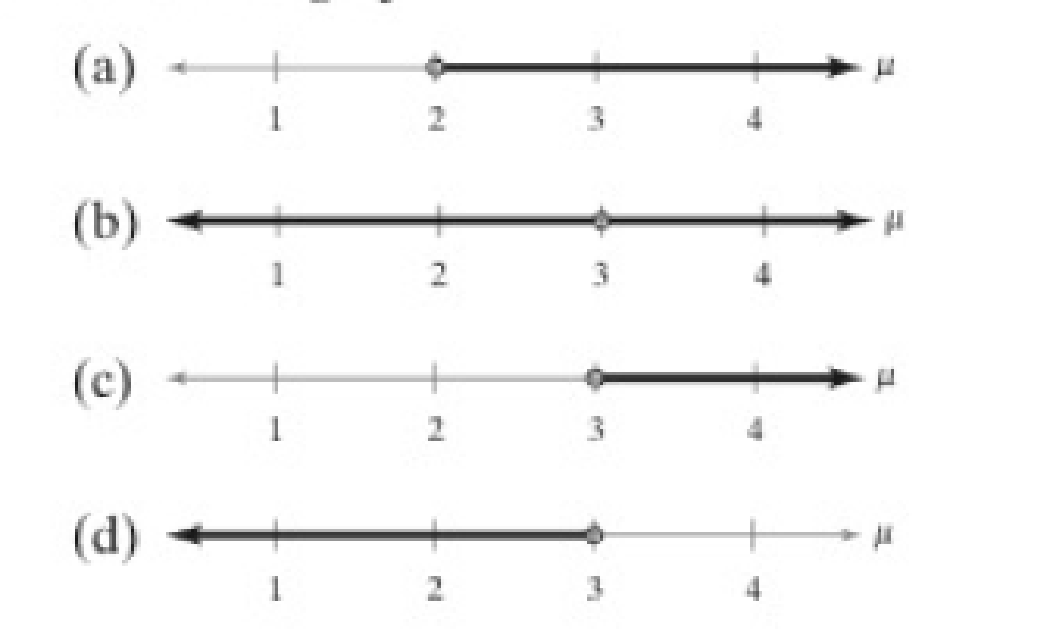
Expert Solution & Answer
Want to see the full answer?
Check out a sample textbook solution
Students have asked these similar questions
a) Test the null hypothesis that, in the presence of X1 and X3, X2 contributes no use-ful information for predicting Y . Please, provide: hypotheses, test statistic, p-value (orrejection region), and conclusion. Use α = 0.05. Could X2 be removed from the model?
b)b) Test the null hypothesis that, in the presence of X3 = the number of square feet of living space,the two independent variables X1 = the number of bedrooms and X2 = the number of bathroomsare insignificant predictors of Y . Please, provide: hypotheses, test statistic, p-value (orrejection region), and conclusion. Use α = 0.05.
Consider the hypothesis: Working at least 5 hours per day at a computer contributes to deterioration of eyesight. The alternative hypothesis is:
A. Working for less than 5 hours a day at a computer contributes to deterioration of eyesight.
B. Working at least 5 hours a day at a computer does not contribute to deterioration of eyesight.
C. Working at least 5 hours a day at a computer contributes to the deterioration of eyesight.
D. Working at least 5 hours a day at a computer improves eyesight.
I’m working on a prey-predator simulation. Im trying to see whether the size of prey influences how fast the predator captures the prey. The image shows the size of prey (10 and 70) and the time taken (capture rate) The average for 10 is 3.26 and 2.4 for 70. I need to use hypothesis testing on 2 means.
My hypothesis is that bigger size equals faster Capture rates, so I’m assuming my null hypothesis will be that μ of 10= μ of 70 and the alternative hypothesis is μ 10
Chapter 7 Solutions
Elementary Statistics Books a la carte Plus NEW MyLab Statistics with Pearson eText - Access Card Package (6th Edition)
Ch. 7.1 - Prob. 1TYCh. 7.1 - Prob. 2TYCh. 7.1 - Prob. 3TYCh. 7.1 - Prob. 4TYCh. 7.1 - Prob. 5TYCh. 7.1 - What are the two types of hypotheses used in a...Ch. 7.1 - Describe the two types of errors possible in a...Ch. 7.1 - Prob. 3ECh. 7.1 - Does failing to reject the null hypothesis mean...Ch. 7.1 - True or False? In Exercises 510, determine whether...
Ch. 7.1 - True or False? In Exercises 510, determine whether...Ch. 7.1 - True or False? In Exercises 510, determine whether...Ch. 7.1 - True or False? In Exercises 510, determine whether...Ch. 7.1 - True or False? In Exercises 510, determine whether...Ch. 7.1 - True or False? In Exercises 510, determine whether...Ch. 7.1 - Stating Hypotheses In Exercises 1116, the...Ch. 7.1 - Stating Hypotheses In Exercises 1116, the...Ch. 7.1 - Stating Hypotheses In Exercises 1116, the...Ch. 7.1 - Stating Hypotheses In Exercises 1116, the...Ch. 7.1 - Stating Hypotheses In Exercises 1116, the...Ch. 7.1 - Stating Hypotheses In Exercises 1116, the...Ch. 7.1 - Graphical Analysis In Exercises 1720, match the...Ch. 7.1 - Graphical Analysis In Exercises 1720, match the...Ch. 7.1 - Graphical Analysis In Exercises 1720, match the...Ch. 7.1 - Graphical Analysis In Exercises 1720, match the...Ch. 7.1 - Identifying a Test In Exercises 2124, determine...Ch. 7.1 - Identifying a Test In Exercises 2124, determine...Ch. 7.1 - Identifying a Test In Exercises 2124, determine...Ch. 7.1 - Identifying a Test In Exercises 2124, determine...Ch. 7.1 - Prob. 25ECh. 7.1 - Stating the Null and Alternative Hypotheses In...Ch. 7.1 - Stating the Null and Alternative Hypotheses In...Ch. 7.1 - Stating the Null and Alternative Hypotheses In...Ch. 7.1 - Prob. 29ECh. 7.1 - Prob. 30ECh. 7.1 - Prob. 31ECh. 7.1 - Prob. 32ECh. 7.1 - Identifying Type I and Type II Errors In Exercises...Ch. 7.1 - Identifying Type I and Type II Errors In Exercises...Ch. 7.1 - Prob. 35ECh. 7.1 - Prob. 36ECh. 7.1 - Prob. 37ECh. 7.1 - Prob. 38ECh. 7.1 - Prob. 39ECh. 7.1 - Prob. 40ECh. 7.1 - Prob. 41ECh. 7.1 - Prob. 42ECh. 7.1 - Interpreting a Decision In Exercises 4348,...Ch. 7.1 - Prob. 44ECh. 7.1 - Interpreting a Decision In Exercises 4348,...Ch. 7.1 - Interpreting a Decision In Exercises 4348,...Ch. 7.1 - Prob. 47ECh. 7.1 - Prob. 48ECh. 7.1 - Writing Hypotheses: Medicine A medical research...Ch. 7.1 - Writing Hypotheses: Transportation Network Company...Ch. 7.1 - Prob. 51ECh. 7.1 - Writing Hypotheses: Internet Provider An Internet...Ch. 7.1 - Prob. 53ECh. 7.1 - Getting at the Concept Explain why a level of...Ch. 7.1 - Prob. 55ECh. 7.1 - Prob. 56ECh. 7.1 - Graphical Analysis In Exercises 5760, you are...Ch. 7.1 - Graphical Analysis In Exercises 5760, you are...Ch. 7.1 - Graphical Analysis In Exercises 5760, you are...Ch. 7.1 - Graphical Analysis In Exercises 5760, you are...Ch. 7.2 - Prob. 1TYCh. 7.2 - Prob. 2TYCh. 7.2 - Prob. 3TYCh. 7.2 - Prob. 4TYCh. 7.2 - Prob. 5TYCh. 7.2 - Prob. 6TYCh. 7.2 - Prob. 7TYCh. 7.2 - Prob. 8TYCh. 7.2 - Prob. 9TYCh. 7.2 - Prob. 10TYCh. 7.2 - Explain the difference between the z-test for ...Ch. 7.2 - In hypothesis testing, does using the critical...Ch. 7.2 - Interpreting a P-Value In Exercises 38, the...Ch. 7.2 - Interpreting a P-Value In Exercises 38, the...Ch. 7.2 - Interpreting a P-Value In Exercises 38, the...Ch. 7.2 - Interpreting a P-Value In Exercises 38, the...Ch. 7.2 - Interpreting a P-Value In Exercises 38, the...Ch. 7.2 - Interpreting a P-Value In Exercises 38, the...Ch. 7.2 - Finding a P-Value In Exercises 914, find the...Ch. 7.2 - Finding a P-Value In Exercises 914, find the...Ch. 7.2 - Finding a P-Value In Exercises 914, find the...Ch. 7.2 - Finding a P-Value In Exercises 914, find the...Ch. 7.2 - Finding a P-Value In Exercises 914, find the...Ch. 7.2 - Finding a P-Value In Exercises 914, find the...Ch. 7.2 - Graphical Analysis In Exercises 15 and 16, match...Ch. 7.2 - Graphical Analysis In Exercises 15 and 16, match...Ch. 7.2 - In Exercises 17 and 18, use the TI-84 Plus...Ch. 7.2 - In Exercises 17 and 18, use the TI-84 Plus...Ch. 7.2 - Finding Critical Values and Rejection Regions In...Ch. 7.2 - Finding Critical Values and Rejection Regions In...Ch. 7.2 - Finding Critical Values and Rejection Regions In...Ch. 7.2 - Finding Critical Values and Rejection Regions In...Ch. 7.2 - Finding Critical Values and Rejection Regions In...Ch. 7.2 - Prob. 24ECh. 7.2 - Graphical Analysis In Exercises 25 and 26, state...Ch. 7.2 - Graphical Analysis In Exercises 25 and 26, state...Ch. 7.2 - In Exercises 2730, test the claim about the...Ch. 7.2 - Prob. 28ECh. 7.2 - Prob. 29ECh. 7.2 - In Exercises 2730, test the claim about the...Ch. 7.2 - Prob. 31ECh. 7.2 - Hypothesis Testing Using a P-Value In Exercises...Ch. 7.2 - Prob. 33ECh. 7.2 - Prob. 34ECh. 7.2 - Prob. 35ECh. 7.2 - Prob. 36ECh. 7.2 - Prob. 37ECh. 7.2 - Prob. 38ECh. 7.2 - Hypothesis Testing Using Rejection Region(s) In...Ch. 7.2 - Hypothesis Testing Using Rejection Region(s) In...Ch. 7.2 - Prob. 41ECh. 7.2 - Prob. 42ECh. 7.2 - Writing When P , does the standardized test...Ch. 7.2 - Writing In a right-tailed test where P , does the...Ch. 7.3 - Prob. 1TYCh. 7.3 - Prob. 2TYCh. 7.3 - Prob. 3TYCh. 7.3 - Prob. 4TYCh. 7.3 - Prob. 5TYCh. 7.3 - Prob. 6TYCh. 7.3 - Explain how to find critical values for a...Ch. 7.3 - Explain how to use a t-test to test a hypothesized...Ch. 7.3 - In Exercises 38, find the critical value(s) and...Ch. 7.3 - In Exercises 38, find the critical value(s) and...Ch. 7.3 - In Exercises 38, find the critical value(s) and...Ch. 7.3 - In Exercises 38, find the critical value(s) and...Ch. 7.3 - In Exercises 38, find the critical value(s) and...Ch. 7.3 - In Exercises 38, find the critical value(s) and...Ch. 7.3 - Prob. 9ECh. 7.3 - Prob. 10ECh. 7.3 - In Exercises 1318, test the claim about the...Ch. 7.3 - In Exercises 1318, test the claim about the...Ch. 7.3 - In Exercises 1318, test the claim about the...Ch. 7.3 - In Exercises 1318, test the claim about the...Ch. 7.3 - Hypothesis Testing Using Rejection Regions In...Ch. 7.3 - Prob. 16ECh. 7.3 - Prob. 17ECh. 7.3 - Prob. 18ECh. 7.3 - Prob. 19ECh. 7.3 - Prob. 20ECh. 7.3 - Prob. 21ECh. 7.3 - Prob. 22ECh. 7.3 - Prob. 23ECh. 7.3 - Prob. 24ECh. 7.3 - Prob. 25ECh. 7.3 - Prob. 26ECh. 7.3 - Using a P-Value with a t-Test In Exercises 2730,...Ch. 7.3 - Using a P-Value with a t-Test In Exercises 2730,...Ch. 7.3 - Deciding on a Distribution In Exercises 31 and 32,...Ch. 7.3 - Prob. 30ECh. 7.3 - Writing You are testing a claim and incorrectly...Ch. 7.3 - Prob. 1ACh. 7.3 - Prob. 2ACh. 7.3 - Prob. 3ACh. 7.3 - Human Body Temperature: Whats Normal? In an...Ch. 7.3 - Human Body Temperature: Whats Normal? In an...Ch. 7.3 - Human Body Temperature: Whats Normal? In an...Ch. 7.3 - Human Body Temperature: Whats Normal? In an...Ch. 7.3 - Human Body Temperature: Whats Normal? In an...Ch. 7.3 - In an article in the Journal of Statistics...Ch. 7.4 - Prob. 1TYCh. 7.4 - Prob. 2TYCh. 7.4 - Explain how to determine whether a normal...Ch. 7.4 - Explain how to test a population proportion p.Ch. 7.4 - In Exercises 36, determine whether a normal...Ch. 7.4 - In Exercises 36, determine whether a normal...Ch. 7.4 - In Exercises 36, determine whether a normal...Ch. 7.4 - In Exercises 36, determine whether a normal...Ch. 7.4 - Prob. 7ECh. 7.4 - Prob. 8ECh. 7.4 - Prob. 9ECh. 7.4 - Prob. 10ECh. 7.4 - Prob. 11ECh. 7.4 - Prob. 12ECh. 7.4 - Prob. 13ECh. 7.4 - Prob. 14ECh. 7.4 - Prob. 15ECh. 7.4 - Prob. 16ECh. 7.4 - Prob. 17ECh. 7.4 - Prob. 18ECh. 7.4 - Prob. 19ECh. 7.4 - The alternative formula is derived from the...Ch. 7.4 - Prob. 1ACh. 7.4 - Prob. 2ACh. 7.5 - Prob. 1TYCh. 7.5 - Prob. 2TYCh. 7.5 - Prob. 3TYCh. 7.5 - Prob. 4TYCh. 7.5 - Prob. 5TYCh. 7.5 - Prob. 6TYCh. 7.5 - Explain how to find critical values in a...Ch. 7.5 - Can a critical value for the chi-square test be...Ch. 7.5 - Prob. 3ECh. 7.5 - Prob. 4ECh. 7.5 - In Exercises 512, find the critical value(s) and...Ch. 7.5 - In Exercises 512, find the critical value(s) and...Ch. 7.5 - In Exercises 512, find the critical value(s) and...Ch. 7.5 - In Exercises 512, find the critical value(s) and...Ch. 7.5 - In Exercises 512, find the critical value(s) and...Ch. 7.5 - In Exercises 512, find the critical value(s) and...Ch. 7.5 - Graphical Analysis In Exercises 13 and 14, state...Ch. 7.5 - Prob. 12ECh. 7.5 - In Exercises 1522, test the claim about the...Ch. 7.5 - Prob. 14ECh. 7.5 - In Exercises 1522, test the claim about the...Ch. 7.5 - In Exercises 1522, test the claim about the...Ch. 7.5 - Hypothesis Testing Using Rejection Regions In...Ch. 7.5 - Prob. 18ECh. 7.5 - Prob. 19ECh. 7.5 - Prob. 20ECh. 7.5 - Hypothesis Testing Using Rejection Regions In...Ch. 7.5 - Prob. 22ECh. 7.5 - Prob. 23ECh. 7.5 - Prob. 24ECh. 7.5 - Prob. 25ECh. 7.5 - Prob. 26ECh. 7.5 - Prob. 27ECh. 7.5 - Prob. 28ECh. 7 - Prob. 1UACh. 7 - Prob. 2UACh. 7 - Prob. 3UACh. 7 - Prob. 4UACh. 7 - In Exercises 16, the statement represents a claim....Ch. 7 - In Exercises 16, the statement represents a claim....Ch. 7 - Prob. 7.1.3RECh. 7 - In Exercises 16, the statement represents a claim....Ch. 7 - Prob. 7.1.5RECh. 7 - In Exercises 16, the statement represents a claim....Ch. 7 - Prob. 7.1.7RECh. 7 - Prob. 7.1.8RECh. 7 - Prob. 7.1.9RECh. 7 - In Exercises 710, (a) state the null and...Ch. 7 - In Exercises 11 and 12, find the P-value for the...Ch. 7 - Prob. 7.2.12RECh. 7 - In Exercises 25 and 26, (a) identify the claim and...Ch. 7 - In Exercises 25 and 26, (a) identify the claim and...Ch. 7 - Prob. 7.2.15RECh. 7 - In Exercises 1316, find the critical value(s) and...Ch. 7 - Prob. 7.2.17RECh. 7 - Prob. 7.2.18RECh. 7 - Prob. 7.2.19RECh. 7 - In Exercises 1720, state whether the standardized...Ch. 7 - In Exercises 1720, state whether the standardized...Ch. 7 - In Exercises 1720, state whether the standardized...Ch. 7 - In Exercises 2124, test the claim about the...Ch. 7 - In Exercises 2124, test the claim about the...Ch. 7 - In Exercises 2124, test the claim about the...Ch. 7 - Prob. 7.2.26RECh. 7 - Prob. 7.2.27RECh. 7 - Prob. 7.2.28RECh. 7 - Prob. 7.3.29RECh. 7 - In Exercises 2934, find the critical value(s) and...Ch. 7 - Prob. 7.3.31RECh. 7 - In Exercises 2934, find the critical value(s) and...Ch. 7 - Prob. 7.3.33RECh. 7 - Prob. 7.3.34RECh. 7 - In Exercises 3540, test the claim about the...Ch. 7 - In Exercises 3540, test the claim about the...Ch. 7 - In Exercises 41 and 42, (a) identify the claim and...Ch. 7 - In Exercises 41 and 42, (a) identify the claim and...Ch. 7 - Prob. 7.3.39RECh. 7 - Prob. 7.3.40RECh. 7 - Prob. 7.4.41RECh. 7 - Prob. 7.4.42RECh. 7 - In Exercises 4548, determine whether a normal...Ch. 7 - In Exercises 4548, determine whether a normal...Ch. 7 - Prob. 7.4.45RECh. 7 - Prob. 7.4.46RECh. 7 - Prob. 7.5.47RECh. 7 - Prob. 7.5.48RECh. 7 - Prob. 7.5.49RECh. 7 - Prob. 7.5.50RECh. 7 - Prob. 7.5.51RECh. 7 - Prob. 7.5.52RECh. 7 - Prob. 7.5.53RECh. 7 - In Exercises 5558, test the claim about the...Ch. 7 - Prob. 7.5.55RECh. 7 - Prob. 7.5.56RECh. 7 - Prob. 7.5.57RECh. 7 - Take this quiz as you would take a quiz in class....Ch. 7 - Prob. 2CQCh. 7 - Prob. 3CQCh. 7 - Prob. 4CQCh. 7 - Prob. 5CQCh. 7 - Prob. 6CQCh. 7 - Prob. 1CTCh. 7 - Prob. 2CTCh. 7 - Prob. 3CTCh. 7 - Prob. 4CTCh. 7 - Take this quiz as you would take a quiz in class....Ch. 7 - Prob. 6CTCh. 7 - Prob. 7CTCh. 7 - Prob. 1RSRDCh. 7 - Prob. 2RSRDCh. 7 - Prob. 3RSRDCh. 7 - Prob. 4RSRDCh. 7 - EXERCISES 1. The Minilab display below shows a...Ch. 7 - In Exercise 1, you rejected the claim that p =...Ch. 7 - Prob. 3TCh. 7 - Describe a hypothesis test for Judge Fords random...
Knowledge Booster


Learn more about
Need a deep-dive on the concept behind this application? Look no further. Learn more about this topic, statistics and related others by exploring similar questions and additional content below.Similar questions
- A researcher's survey results indicate that about 50% of 12th graders consume less than 300g of vegetables at lunch, about 40% consume 300-600g, and only 10% of them consume more than 600g. A high school conducted a survey of student diets and health information, and reported data about 12th graders' vegetable intake at lunch is reported in the table photo. If researchers wants to find out whether the high school has the same proportions of 12th graders in the vegetable intake categories as reported by the survey, what would the appropiate test statistic be to use and why. Choosing between an ANOVA, Chi -Square independence tests, Chi Square Goodness of Fit, and One sample proportion test?arrow_forwardDefine hypothesis? Refer the given model and develop alternate hypotheses of each variable. (Hint: Only adopt one approach, i.e., directional or non-directional).arrow_forwardA test of null hypothesis H0= u=u0 gives test statistic z=-1.82. Graph the probablities of each question. a) What is the p-value if the alternative Ha: u>u0 b) What is the p-value if the alternative Ha: u<u0 c) what is the p-value if the alternative Ha: u does not equal u0arrow_forward
- A gardener is interested in seeing if sunlight and fertilizer type interact so that the effect of fertilizer type depends on the amount of sunlight that plants receive. The gardener randomly assigns half of the plants to be in sunlight and half the plants to be in shade. The gardener also randomly assigns half of the plants to receive the new fertilizer and half to receive an old fertilizer. After a month, the gardener measures plant height. 1 What hypothesis test would be most appropriate for answering this research question and why? 2 What are the independent and dependent variables (if any)? 3 How many levels do the independent variable(s) have?arrow_forwardResearch is interested in the relationship of video games of high school students' SAT scores, and he hypothesizes that students who play video games for a longer time are predicted to have a lower SAT score. To test his hypothesis, he randomly selected 60 high school students and asked: 1) how many hours do you spend playing video games each week? 2) what is your SAT score? a) What is the research question? b) What graphs can be used to display the video games time and SAT score visually? c) What statistical test can be used to answer the research question?arrow_forwardRedo exercises 17 and 18 in section 8.1 of your textbook, about the small animal who lives in an area with woods and meadows, using the following data:If the animal is in the woods on one observation, then it is three times as likely to be in the woods as the meadows on the next observation. If the animal is in the meadows on one observation, then it is four times as likely to be in the meadows as the woods on the next observation.Assume that state 1 is being in the meadows and that state 2 is being in the woods. (A) If the animal is initially in the woods, what is the probability that it is in the woods on the next three observations? (B) If the animal is initially in the woods, what is the probability that it is in the meadow on the next three observations?arrow_forward
- K:56) Somehow you manage to build a fair 3-sided die, equally likely to show 1, 2, or 3 every time it is rolled. You roll the die twice, with the results each time being independent. If X is the maximum of the 2 numbers rolled and Y is the sum of the 2 numbers rolled, find the correlation ρ(X, Y ).arrow_forwardA dietitian wants to test if on the average a person’s cholesterol level will be lowered if their diet is supplemented with a certain mineral. Six subjects have their cholesterol level tested before taking this mineral and again after taking this mineral for a 3 months. The measured cholesterol levels are listed in the table below: Level Before Mineral 210 235 208 190 172 244 Level After Mineral 190 170 210 188 173 228 When doing a Hypothesis Test to test this dietitian's claim the Degree of Freedom used and the computed P-value are A.) Degree of Freedom = 10 and P-value = 0.1349 B.) Degree of Freedom = 9.6562 and P-value = 0.1354 C.) Degree of Freedom = 5 and P-Value = 0.1688 D.) Degree of Freedom = 5 and P-value = 0.0844arrow_forwardedo exercises 17 and 18 in section 8.1 of your textbook, about the small animal who lives in an area with woods and meadows, using the following data:If the animal is in the woods on one observation, then it is twice as likely to be in the woods as the meadows on the next observation. If the animal is in the meadows on one observation, then it is three times as likely to be in the meadows as the woods on the next observation.Assume that state 1 is being in the meadows and that state 2 is being in the woods.(1) Find the transition matrix for this Markov process. (2) If the animal is initially in the woods, what is the probability that it is in the woods on the next three observations? (3) If the animal is initially in the woods, what is the probability that it is in the meadow on the next three observations?arrow_forward
- Elephants and hippos We removed humans from thescatterplot in Exercise 31 because our species was anoutlier in life expectancy. The resulting scatterplot showstwo points that now may be of concern. The point in theupper right corner of this scatterplot is for elephants, andthe other point at the far right is for hippos.a) By removing one of these points, we could makethe association appear to be stronger. Which point?Explain.b) Would the slope of the line increase or decrease?c) Should we just keep removing animals to increase thestrength of the model? Explain.d) If we remove elephants from the scatterplot, the slopeof the regression line becomes 11.6 days per year. Doyou think elephants were an influential point? Explain.arrow_forwardA researcher selects a sample and administers a treatment to the individuals in the sample. If the sample is used for a hypothesis test, what does the alternative hypothesis (H1) say about the treatment a. The treatment causes a change in the scores. b. The treatment adds a constant to each score. c. The treatment multiplies each score by a constant. d. The treatment has no effect on the scores.arrow_forwardTest the hypothesis a. There is no significant difference between the perceived level of riskiness of thrill behavior in males and in females (a=0.05) b. There is no significant difference between the perceived level of riskiness of rebellious behavior in males and in females (a=0.10) c. There is no significant difference between the level of riskiness of thrill-seeking items and rebellious items as perceived by the males (a=0.05)arrow_forward
arrow_back_ios
SEE MORE QUESTIONS
arrow_forward_ios
Recommended textbooks for you
 Algebra & Trigonometry with Analytic GeometryAlgebraISBN:9781133382119Author:SwokowskiPublisher:Cengage
 Big Ideas Math A Bridge To Success Algebra 1: Stu...AlgebraISBN:9781680331141Author:HOUGHTON MIFFLIN HARCOURTPublisher:Houghton Mifflin Harcourt
Algebra & Trigonometry with Analytic Geometry
Algebra
ISBN:9781133382119
Author:Swokowski
Publisher:Cengage
Big Ideas Math A Bridge To Success Algebra 1: Stu...
Algebra
ISBN:9781680331141
Author:HOUGHTON MIFFLIN HARCOURT
Publisher:Houghton Mifflin Harcourt
Hypothesis Testing - Solving Problems With Proportions; Author: The Organic Chemistry Tutor;https://www.youtube.com/watch?v=76VruarGn2Q;License: Standard YouTube License, CC-BY
Hypothesis Testing and Confidence Intervals (FRM Part 1 – Book 2 – Chapter 5); Author: Analystprep;https://www.youtube.com/watch?v=vth3yZIUlGQ;License: Standard YouTube License, CC-BY