
Essentials of Statistics (6th Edition)
6th Edition
ISBN: 9780134687155
Author: Triola
Publisher: PEARSON
expand_more
expand_more
format_list_bulleted
Videos
Textbook Question
Chapter 7.2, Problem 6BSC
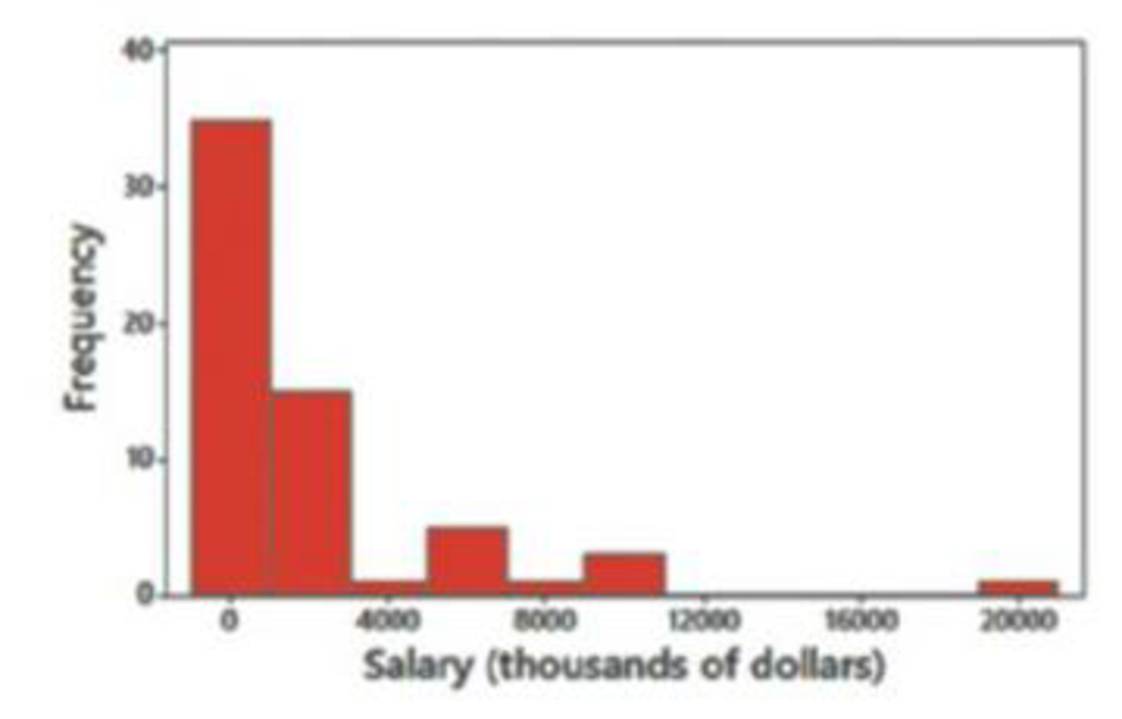
Using Correct Distribution. In Exercises 5–8, assume that we want to construct a confidence interval. Do one of the following, as appropriate: (a) Find the critical value tα/2, (b) find the critical value zα/2 or (c) state that neither the
6. Denver Bronco Salaries Confidence level is 90%, σ is not known, and the histogram of 61 player salaries (thousands of dollars) is as shown.
Expert Solution & Answer

Learn your wayIncludes step-by-step video

schedule01:50
Students have asked these similar questions
Delores must grade a driver's test completed by a group of training students. She knows that driver's test scores are normally distributed with mu = 50 and sigma = 6 6. Students are required to score in the top 75% of students on the test in order to pass the test and continue on with the training course. Which score do students need to obtain at a minimum in order to pass the test and continue with the course ?
Bighorn sheep are beautiful wild animals found throughout the western United States. Let x be the age of a bighorn sheep (in years), and let y be the mortality rate (percent that die) for this age group. For example, x = 1, y = 14 means that 14% of the bighorn sheep between 1 and 2 years old died. A random sample of Arizona bighorn sheep gave the following information:
x
1
2
3
4
5
y
15.8
18.1
14.4
19.6
20.0
Σx = 15; Σy = 87.9; Σx2 = 55; Σy2 = 1,568.77; Σxy = 273.6
(a) Find x, y, b, and the equation of the least-squares line. (Round your answers for x and y to two decimal places. Round your least-squares estimates to three decimal places.)
x
=
y
=
b
=
ŷ
=
+ x
Bighorn sheep are beautiful wild animals found throughout the western United States. Let x be the age of a bighorn sheep (in years), and let y be the mortality rate (percent that die) for this age group. For example, x = 1, y = 14 means that 14% of the bighorn sheep between 1 and 2 years old died. A random sample of Arizona bighorn sheep gave the following information:
x
1
2
3
4
5
y
12.2
17.5
14.4
19.6
20.0
(c) Find the sample correlation coefficient r and the coefficient of determination r2. (Round your answers to three decimal places.)
r =
?
r2 =
?
What percentage of variation in y is explained by the least-squares model? __________ %(Round your answer to one decimal place.)
incorrect answers: I submitted this question and was told this is the answer but it is NOT CORRECT. please help !!
r=0.800
r2= 0.640
64%
( above answers are incorrect)
Chapter 7 Solutions
Essentials of Statistics (6th Edition)
Ch. 7.1 - Poll Results in the Media USA Today provided...Ch. 7.1 - Margin of Error For the poll described in Exercise...Ch. 7.1 - Notation For the poll described in Exercise 1,...Ch. 7.1 - Confidence Levels Given specific sample data, such...Ch. 7.1 - Finding Critical Values. In Exercises 58, find the...Ch. 7.1 - Finding Critical Values. In Exercises 58, find the...Ch. 7.1 - Finding Critical Values. In Exercises 58, find the...Ch. 7.1 - Finding Critical Values. In Exercises 58, find the...Ch. 7.1 - Formats of Confidence Intervals. In Exercises 912,...Ch. 7.1 - Formats of Confidence Intervals. In Exercises 912,...
Ch. 7.1 - Formats of Confidence Intervals. In Exercises 912,...Ch. 7.1 - Formats of Confidence Intervals. In Exercises 912,...Ch. 7.1 - Constructing and Interpreting Confidence...Ch. 7.1 - Constructing and Interpreting Confidence...Ch. 7.1 - Constructing and Interpreting Confidence...Ch. 7.1 - Constructing and Interpreting Confidence...Ch. 7.1 - Critical Thinking. In Exercises 1728, use the data...Ch. 7.1 - Critical Thinking. In Exercises 1728, use the data...Ch. 7.1 - Critical Thinking. In Exercises 1728, use the data...Ch. 7.1 - Critical Thinking. In Exercises 1728, use the data...Ch. 7.1 - Touch Therapy When she was 9 years of age, Emily...Ch. 7.1 - Critical Thinking. In Exercises 1728, use the data...Ch. 7.1 - Critical Thinking. In Exercises 1728, use the data...Ch. 7.1 - Critical Thinking. In Exercises 1728, use the data...Ch. 7.1 - Critical Thinking. In Exercises 1728, use the data...Ch. 7.1 - Critical Thinking. In Exercises 1728, use the data...Ch. 7.1 - Critical Thinking. In Exercises 1728, use the data...Ch. 7.1 - Critical Thinking. In Exercises 1728, use the data...Ch. 7.1 - Determining Sample Size. In Exercises 3138, use...Ch. 7.1 - Determining Sample Size. In Exercises 3138, use...Ch. 7.1 - Determining Sample Size. In Exercises 3138, use...Ch. 7.1 - Determining Sample Size. In Exercises 3138, use...Ch. 7.1 - Determining Sample Size. In Exercises 3138, use...Ch. 7.1 - Determining Sample Size. In Exercises 3138, use...Ch. 7.1 - Determining Sample Size. In Exercises 3138, use...Ch. 7.1 - Determining Sample Size. In Exercises 3138, use...Ch. 7.1 - Finite Population Correction Factor For Formulas...Ch. 7.1 - One-Sided Confidence Interval A one-sided claim...Ch. 7.1 - Coping with No Success According to the Rule of...Ch. 7.2 - In Exercises 13, refer to the accompanying screen...Ch. 7.2 - Statistical Literacy and Critical Thinking In...Ch. 7.2 - In Exercises 13, refer to the accompanying screen...Ch. 7.2 - Normality Requirement What does it mean when we...Ch. 7.2 - Using Correct Distribution. In Exercises 58,...Ch. 7.2 - Using Correct Distribution. In Exercises 58,...Ch. 7.2 - Using Correct Distribution. In Exercises 58,...Ch. 7.2 - Using Correct Distribution. In Exercises 58,...Ch. 7.2 - Confidence Intervals. In Exercises 924, construct...Ch. 7.2 - Confidence Intervals. In Exercises 924, construct...Ch. 7.2 - Confidence Intervals. In Exercises 924, construct...Ch. 7.2 - Confidence Intervals. In Exercises 924, construct...Ch. 7.2 - Confidence Intervals. In Exercises 924, construct...Ch. 7.2 - Confidence Intervals. In Exercises 924, construct...Ch. 7.2 - Confidence Intervals. In Exercises 924, construct...Ch. 7.2 - Confidence Intervals. In Exercises 924, construct...Ch. 7.2 - Confidence Intervals. In Exercises 924, construct...Ch. 7.2 - Confidence Intervals. In Exercises 924, construct...Ch. 7.2 - Confidence Intervals. In Exercises 924, construct...Ch. 7.2 - Confidence Intervals. In Exercises 924, construct...Ch. 7.2 - Confidence Intervals. In Exercises 924, construct...Ch. 7.2 - Confidence Intervals. In Exercises 924, construct...Ch. 7.2 - Confidence Intervals. In Exercises 924, construct...Ch. 7.2 - Confidence Intervals. In Exercises 924, construct...Ch. 7.2 - Sample Size. In Exercises 2936, find the sample...Ch. 7.2 - Sample Size. In Exercises 2936, find the sample...Ch. 7.2 - Sample Size. In Exercises 2936, find the sample...Ch. 7.2 - Sample Size. In Exercises 2936, find the sample...Ch. 7.2 - Sample Size. In Exercises 2936, find the sample...Ch. 7.2 - Sample Size. In Exercises 2936, find the sample...Ch. 7.2 - Sample Size. In Exercises 2936, find the sample...Ch. 7.2 - Sample Size. In Exercises 2936, find the sample...Ch. 7.2 - Confidence Interval with Known . In Exercises 37...Ch. 7.2 - Confidence Interval with Known . In Exercises 37...Ch. 7.2 - Finite Population Correction Factor If a simple...Ch. 7.3 - Brain Volume Using all of the brain volumes listed...Ch. 7.3 - Expressing Confidence Intervals Example 2 showed...Ch. 7.3 - Last Digit Analysis The dotplot below depicts the...Ch. 7.3 - Normality Requirement What is different about the...Ch. 7.3 - Finding Critical Values and Confidence Intervals....Ch. 7.3 - Finding Critical Values and Confidence Intervals....Ch. 7.3 - Finding Critical Values and Confidence Intervals....Ch. 7.3 - Finding Critical Values and Confidence Intervals....Ch. 7.3 - Finding Confidence Intervals. In Exercises 916,...Ch. 7.3 - Finding Confidence Intervals. In Exercises 916,...Ch. 7.3 - Finding Confidence Intervals. In Exercises 916,...Ch. 7.3 - Finding Confidence Intervals. In Exercises 916,...Ch. 7.3 - Finding Confidence Intervals. In Exercises 916,...Ch. 7.3 - Finding Confidence Intervals. In Exercises 916,...Ch. 7.3 - Finding Confidence Intervals. In Exercises 916,...Ch. 7.3 - Comparing Waiting Lines a. The values listed below...Ch. 7.3 - Determining Sample Size. In Exercises 1922, assume...Ch. 7.3 - Determining Sample Size. In Exercises 1922, assume...Ch. 7.3 - Determining Sample Size. In Exercises 1922, assume...Ch. 7.3 - Determining Sample Size. In Exercises 1922, assume...Ch. 7.3 - Finding Critical Values In constructing confidence...Ch. 7.3 - Finding Sample Size Instead of using Table 7-2 for...Ch. 7.4 - Replacement Why does the bootstrap method require...Ch. 7.4 - Bootstrap Sample Here is a random sample of...Ch. 7.4 - Bootstrap Sample Given the sample data from...Ch. 7.4 - Prob. 4BSCCh. 7.4 - In Exercises 58, use the relatively small number...Ch. 7.4 - In Exercises 58, use the relatively small number...Ch. 7.4 - In Exercises 58, use the relatively small number...Ch. 7.4 - In Exercises 58, use the relatively small number...Ch. 7 - Celebrities and the Law Here is a 95% confidence...Ch. 7 - Interpreting CI Write a brief statement that...Ch. 7 - Critical Value For the survey described in...Ch. 7 - Loose Change USA Today reported that 40% of people...Ch. 7 - Sample Size for Proportion Find the sample size...Ch. 7 - Sample Size for Mean Find the sample size required...Ch. 7 - Requirements A quality control analyst has...Ch. 7 - Degrees of Freedom In general, what does degrees...Ch. 7 - Critical Value Refer to Exercise 7 Requirements...Ch. 7 - Which Method? Refer to Exercise 7 Requirements and...Ch. 7 - Online News In a Harris poll of 2036 adults, 40%...Ch. 7 - Computers In order to better plan for student...Ch. 7 - Earthquake Magnitudes Listed below are Richter...Ch. 7 - Lefties There have been several studies conducted...Ch. 7 - Distributions Identify the distribution (normal,...Ch. 7 - Sample Size You have been hired by your new...Ch. 7 - Wristwatch Accuracy Students of the author...Ch. 7 - Wristwatch Accuracy Use the sample data from...Ch. 7 - Flight Arrivals. Listed below are the arrival...Ch. 7 - Flight Arrivals. Listed below are the arrival...Ch. 7 - Flight Arrivals. Listed below are the arrival...Ch. 7 - Flight Arrivals. Listed below are the arrival...Ch. 7 - Normal Distribution Using a larger data set than...Ch. 7 - Sample Size Find the sample size necessary to...Ch. 7 - Prob. 7CRECh. 7 - Normality Assessment A random sample consists of...Ch. 7 - Critical Thinking: What does the survey tell us?...Ch. 7 - Critical Thinking: What does the survey tell us?...Ch. 7 - Critical Thinking: What does the survey tell us?...Ch. 7 - Critical Thinking: What does the survey tell us?...Ch. 7 - Critical Thinking: What does the survey tell us?...
Additional Math Textbook Solutions
Find more solutions based on key concepts
2. Source of Data In conducting a statistical study, why is it important to consider the source of the data?
Elementary Statistics
For a population containing N=902 individual, what code number would you assign for a. the first person on the ...
Basic Business Statistics, Student Value Edition
16. Singers The display shows the heights of some of the singers in a chorus, collected so that the singers cou...
STATS:DATA+MODELS-W/DVD
The important reason for grouping data.
Introductory Statistics (10th Edition)
Interpreting a P-Value In Exercises 3–8, the P-value for a hypothesis test is shown. Use the P-value to decide ...
Elementary Statistics: Picturing the World (6th Edition)
Knowledge Booster


Learn more about
Need a deep-dive on the concept behind this application? Look no further. Learn more about this topic, statistics and related others by exploring similar questions and additional content below.Similar questions
- Bighorn sheep are beautiful wild animals found throughout the western United States. Let x be the age of a bighorn sheep (in years), and let y be the mortality rate (percent that die) for this age group. For example, x = 1, y = 14 means that 14% of the bighorn sheep between 1 and 2 years old died. A random sample of Arizona bighorn sheep gave the following information: x 1 2 3 4 5 y 12.2 20.9 14.4 19.6 20.0 Σx = 15; Σy = 87.1 ; Σx2 = 55; Σy2 =1577.17; Σxy = 275.6 (a) Draw a scatter diagram. (b) Find the equation of the least-squares line. (Round your answers to two decimal places.) ŷ = + x (c) Find r. Find the coefficient of determination r2. (Round your answers to three decimal places.) r = r2 = Explain what these measures mean in the context of the problem. The correlation coefficient r measures the strength of the linear relationship between a bighorn sheep's age and the mortality rate. The coefficient of determination r2 measures the explained…arrow_forwardBighorn sheep are beautiful wild animals found throughout the western United States. Let x be the age of a bighorn sheep (in years), and let y be the mortality rate (percent that die) for this age group. For example, x = 1, y = 14 means that 14% of the bighorn sheep between 1 and 2 years old died. A random sample of Arizona bighorn sheep gave the following information: x 1 2 3 4 5 y 12.2 20.9 14.4 19.6 20.0 Σx = 15; Σy = 87.1 ; Σx2 = 55; Σy2 =1577.17; Σxy = 275.6 d) Test the claim that the population correlation coefficient is positive at the 1% level of significance. (Round your test statistic to three decimal places.) t = e) Find or estimate the P-value of the test statistic. P-value > 0.250 0.125 < P-value < 0.250 0.100 < P-value < 0.125 0.075 < P-value < 0.100 0.050 < P-value < 0.075 0.025 < P-value < 0.050 0.010 < P-value < 0.025 0.005 < P-value < 0.010 0.0005 < P-value < 0.005 P-value < 0.0005 Conclusion Reject the…arrow_forwardBighorn sheep are beautiful wild animals found throughout the western United States. Let x be the age of a bighorn sheep (in years), and let y be the mortality rate (percent that die) for this age group. For example, x = 1, y = 14 means that 14% of the bighorn sheep between 1 and 2 years old died. A random sample of Arizona bighorn sheep gave the following information: x 1 2 3 4 5 y 15.8 17.3 14.4 19.6 20.0 Σx = 15; Σy = 87.1; Σx2 = 55; Σy2 = 1,540.45; Σxy = 272 (a) Find x, y, b, and the equation of the least-squares line. (Round your answers for x and y to two decimal places. Round your least-squares estimates to three decimal places.) x = y = b = ŷ = + x (b) Draw a scatter diagram for the data. Plot the least-squares line on your scatter diagram. (c) Find the sample correlation coefficient r and the coefficient of determination r2. (Round your answers to three decimal places.) r = r2 = What percentage of variation in y is…arrow_forward
- Calculate the 95% confidence intervals for the proportion of children surviving, and the proportion of non-crew adult passengers surviving. We want to use the given data to make inferences about the general population of all large boat crashes, so the data set should be treated as a random sample for this purpose. The 95% confidence interval for survival rate amongst non-crew adults runs from? (Round to one decimal place as needed. Use ascending order.) Frequency table results for Adult/Child: Group: Survival=Alive Count = 711 Adult/Child Frequency Relative Frequency Adult 654 0.91983122 Child 57 0.080168776 Frequency table results for Adult/Child: Group: Survival=Dead Count = 1490 Adult/Child Frequency Relative Frequency Adult 1438 0.96510067 Child 52 0.034899329 Frequency table results for Class: Group: Survival=Alive Count = 711 Class Frequency Relative Frequency Crew 212 0.29817159 First 203 0.28551336 Second 118 0.16596343 Third 178…arrow_forwardExercise 1. Illustrate the value of the following t-distributions. a. two-tailed with a = 10% and df=10. b. one-tailed with a = 5% and df=18. c. two-tailed with a = 5% and n=29.arrow_forwardBighorn sheep are beautiful wild animals found throughout the western United States. Let x be the age of a bighorn sheep (in years), and let y be the mortality rate (percent that die) for this age group. For example, x = 1, y = 14 means that 14% of the bighorn sheep between 1 and 2 years old died. A random sample of Arizona bighorn sheep gave the following information: 1. 3 4 12.2 17.5 14.4 19.6 20.0 A USE SALT Ex = 15; Ey = 83.7; Ex² = 55; Ey? = 1,446.61; Exy = 268.8 (a) Find x, y, b, and the equation of the least-squares line. (Round your answers for x and y to two decimal places. Round your least-squares estimates to three decimal places.) y = (b) Draw a scatter diagram for the data. Plot the least-squares line on your scatter diagram. y y 22 22 20 20 18 18 16 16 14 14 12 12arrow_forward
- A non-profit organization is collecting data about how alcohol consumption affects academic performance. They want to perform a hypothesis test to see whether there is a relationship between how much alcohol a student consumes, and whether they are in good academic standing (GPA greater than or equal to 2.0). The results are summarized in the table below: Drinks 3+ Drinks per week Observed Data Good Academic Standing 137 Poor Academic Standing 40 Total 177 Expected Frequencies Good Academic Standing Poor Academic Standing Total a. Fill in the table of expected frequencies below. Round your answers to 2 decimal places. 177 Drinks 3+ Drinks per week 164 52 216 Ho: Alcohol consumption and academic standing are independent Ha: Alcohol consumption and academic standing are correlated Drinks 1-3 Drinks per week 216 d. Come to a conclusion: O Fail to reject the null hypothesis. O Reject the null hypothesis. Drinks 1-3 Drinks per week Ho: Not drinking any alcohol makes it more likely a student…arrow_forward3arrow_forwardBhuro.0p0arrow_forward
- X y 12 15 9 19 13 11 6 16 22 3 What is the upper bound of the 90% confidence interval for ?arrow_forwardFinal Conclusions. In Exercises 25–28, use a significance level of α = 0.05 and use the given information for the following: a. State a conclusion about the null hypothesis. (Reject H0 or fail to reject H0) b. Without using technical terms or symbols, state a final conclusion that addresses the original claim. Original claim: The standard deviation of pulse rates of adult males is more than 11 bpm. The hypothesis test results in a p-value of 0.3045.arrow_forwardDp4arrow_forward
arrow_back_ios
SEE MORE QUESTIONS
arrow_forward_ios
Recommended textbooks for you
 Glencoe Algebra 1, Student Edition, 9780079039897...AlgebraISBN:9780079039897Author:CarterPublisher:McGraw Hill
Glencoe Algebra 1, Student Edition, 9780079039897...
Algebra
ISBN:9780079039897
Author:Carter
Publisher:McGraw Hill
F- Test or F- statistic (F- Test of Equality of Variance); Author: Prof. Arvind Kumar Sing;https://www.youtube.com/watch?v=PdUt7InTyc8;License: Standard Youtube License
Statistics 101: F-ratio Test for Two Equal Variances; Author: Brandon Foltz;https://www.youtube.com/watch?v=UWQO4gX7-lE;License: Standard YouTube License, CC-BY
Hypothesis Testing and Confidence Intervals (FRM Part 1 – Book 2 – Chapter 5); Author: Analystprep;https://www.youtube.com/watch?v=vth3yZIUlGQ;License: Standard YouTube License, CC-BY
Understanding the Levene's Test for Equality of Variances in SPSS; Author: Dr. Todd Grande;https://www.youtube.com/watch?v=udJr8V2P8Xo;License: Standard Youtube License