
Videos
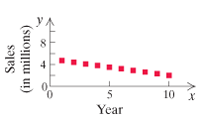
Choosing Models. For the
Linear,
Quadratic,
Quadratic,
Polynomial, neither quadratic nor linear.
Want to see the full answer?
Check out a sample textbook solution
Chapter 7 Solutions
Intermediate Algebra, Books a la Carte Edition, Plus MyLab Math -- Access Card Package (13th Edition)


- In Exercises 5–20, find the equation of each of the lines with the given properties. Sketch the graph of each line.arrow_forwardIn Exercises 65–68, find and sketch the domain of ƒ. Then find an equation for the level curve or surface of the function passing through the given point.arrow_forwardThe figure shows the graphs of the cost and revenue functions for a company that manufactures and sells small radios. Use the information in the figure to solve Exercises 67–72. 35,000 30,000 C(x) = 10,000 + 30x 25,000 20,000 15,000 R(x) = 50x 10,000 5000 100 200 300 400 500 600 700 Radios Produced and Sold 67. How many radios must be produced and sold for the company to break even? 68. More than how many radios must be produced and sold for the company to have a profit? 69. Use the formulas shown in the voice balloons to find R(200) – C(200). Describe what this means for the company. 70. Use the formulas shown in the voice balloons to find R(300) – C(300). Describe what this means for the company. 71. a. Use the formulas shown in the voice balloons to write the company's profit function, P, from producing and selling x radios. b. Find the company's profit if 10,000 radios are produced and sold. 72. a. Use the formulas shown in the voice balloons to write the company's profit function,…arrow_forward
- Use this information to solve Exercises 9–11:A company is planning to produce and sell a new line of computers. The fixed cost will be $360,000 and it will cost $850 to produce each computer. Each computer will be sold for $1150. 9. Write the cost function, C, of producing x computers. 10. Write the revenue function, R, from the sale of x computers. 11. Determine the break-even point. Describe what this means.arrow_forwardIn Exercises 105–108, use a graphing utility to graph each linear function. Then use the TRACE feature to trace along the line and find the coordinates of two points. Use these points to compute the line's slope. Check your result by using the coefficient of x in the line's equation. 105. y = 2x + 4 106. y = -3x + 6 1 107. f(x) = -X- 2 3 108. f(x) = 7*arrow_forwardIn Exercises 41–48, write a piecewise formula for the function.arrow_forward
- U.S. Population The number of White non-Hispanicindividuals in the U.S. civilian non-institutional population 16 years and older was 153.1 million in 2000and is projected to be 169.4 million in 2050.(Source: U.S. Census Bureau)a. Find the average annual rate of change in population during the period 2000–2050, with the appropriate units.b. Use the slope from part (a) and the population in2000 to write the equation of the line associatedwith 2000 and 2050.c. What does this model project the population to bein 2020?arrow_forwardFind the quadratic equation that fits the following set of data points. {(1, – 6),(– 4, – 131),(3, - 54)} Write the equation in standard form, y = ax + bx + c. y =|arrow_forwardExercises 39–42: Decide whether a line can pass through the data points. If it can, determine the slope of the line. 1 2 3 4 39. y -1 3 7 11 15arrow_forward
- Cell Phones Using the CTIA Wireless Survey for1985–2009, the number of U.S. cell phone subscribers (in millions) can be modeled byy = 0.632x2 - 2.651x + 1.209where x is the number of years after 1985.a. Graphically find when the number of U.S.subscribers was 301,617,000.b. When does the model estimate that the number ofU.S. subscribers would reach 359,515,000?c. What does the answer to (b) tell about this model?arrow_forwardWorld Military Expenditure The following chart shows total military and arms trade expenditure from 2011–2020 (t = 1 represents 2011). †A bar graph titled "World military expenditure" has a horizontal t-axis labeled "Year since 2010" and a vertical axis labeled "$ (billions)". The bar graph has 10 bars. Each bar is associated with a label and an approximate value as listed below. 1: 1,800 billion dollars 2: 1,775 billion dollars 3: 1,750 billion dollars 4: 1,730 billion dollars 5: 1,760 billion dollars 6: 1,760 billion dollars 7: 1,850 billion dollars 8: 1,900 billion dollars 9: 1,950 billion dollars 10: 1,980 billion dollars (a) If you want to model the expenditure figures with a function of the form f(t) = at2 + bt + c, would you expect the coefficient a to be positive or negative? Why? HINT [See "Features of a Parabola" in this section.] We would expect the coefficient to be positive because the curve is concave up. We would expect the coefficient to be negative because the…arrow_forwardSection 2.4: Chain Rule In Exercises 9–34, find the derivative of the function.arrow_forward
 Algebra & Trigonometry with Analytic GeometryAlgebraISBN:9781133382119Author:SwokowskiPublisher:Cengage