Concept explainers
Videos
Hershey–Chase Experiments The graph shown in FIGURE 8.5 is reproduced from an original 1952 publication by Hershey and Chase. Bacteriophage were labeled with radioactive tracers and allowed 10 infect bacteria. The virus–bacteria mixtures were then whirled in a blender to dislodge any viral components attached to the exterior of the bacteria. Afterward, radioactivity from the tracers was measured.
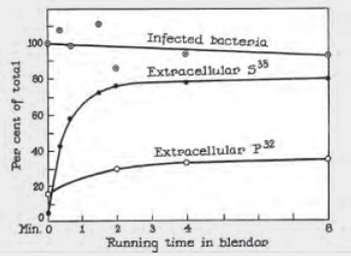
FIGURE 8.5 Detail of Alfred Hershey and Martha Chase’s 1952 publication describing their experiments with bacteriophage.
“Infected bacteria” refers to the percentage of bacteria that survived the blender.
Before blending what percentage of each isotope. 35S and 32P, was extracellular (outside the bacteria)?
To explain: The percentages of
Concept introduction: DNA is the organic molecule that carries information from one generation to another. Several experiments were to be conducted to prove that DNA is the genetic material. One such experiment is the Hershey–Chase experiment commonly known as the blender experiment. Bacteriophages are viruses that infect the bacteria and take up their translation machinery for their life cycle. This property was exploited to prove that DNA is a genetic material along with the help of radioactive isotopes.
Explanation of Solution
A graph was plotted with running time in the blender as X-axis and percentage of radioisotopes and infected bacteria in the Y-axis. Three scatter plots were drawn one for each radioactive tracer
Before blending the mixture that is, at 0 minute the percentage of radioactive tracers were measured. The percentages of
Want to see more full solutions like this?
Chapter 8 Solutions
Biology: The Unity and Diversity of Life (MindTap Course List)
Additional Science Textbook Solutions
Microbiology with Diseases by Body System (5th Edition)
Human Anatomy & Physiology
Microbiology Fundamentals: A Clinical Approach
Anatomy & Physiology: The Unity of Form and Function
SEELEY'S ANATOMY+PHYSIOLOGY
Prescott's Microbiology


- HersheyChase Experiments The graph shown in FIGURE 8.5 is reproduced from an original 1952 publication by Hershey and Chase. Bacteriophage were labeled with radioactive tracers and allowed 10 infect bacteria. The virusbacteria mixtures were then whirled in a blender to dislodge any viral components attached to the exterior of the bacteria. Afterward, radioactivity from the tracers was measured. FIGURE 8.5 Detail of Alfred Hershey and Martha Chases 1952 publication describing their experiments with bacteriophage. Infected bacteria refers to the percentage of bacteria that survived the blender. After 4 minutes in the blender, what percentage of each isotope was extracellular?arrow_forwardHersheyChase Experiments The graph shown in FIGURE 8.5 is reproduced from an original 1952 publication by Hershey and Chase. Bacteriophage were labeled with radioactive tracers and allowed 10 infect bacteria. The virusbacteria mixtures were then whirled in a blender to dislodge any viral components attached to the exterior of the bacteria. Afterward, radioactivity from the tracers was measured. FIGURE 8.5 Detail of Alfred Hershey and Martha Chases 1952 publication describing their experiments with bacteriophage. Infected bacteria refers to the percentage of bacteria that survived the blender. The extracellular concentration of which isotope increased the most with blending?arrow_forwardHersheyChase Experiments The graph shown in FIGURE 8.5 is reproduced from an original 1952 publication by Hershey and Chase. Bacteriophage were labeled with radioactive tracers and allowed 10 infect bacteria. The virusbacteria mixtures were then whirled in a blender to dislodge any viral components attached to the exterior of the bacteria. Afterward, radioactivity from the tracers was measured. FIGURE 8.5 Detail of Alfred Hershey and Martha Chases 1952 publication describing their experiments with bacteriophage. Infected bacteria refers to the percentage of bacteria that survived the blender. Do these results imply that viruses inject DNA or protein into bacteria? Why or why not?arrow_forward
- HersheyChase Experiments The graph shown in FIGURE 8.5 is reproduced from an original 1952 publication by Hershey and Chase. Bacteriophage were labeled with radioactive tracers and allowed 10 infect bacteria. The virusbacteria mixtures were then whirled in a blender to dislodge any viral components attached to the exterior of the bacteria. Afterward, radioactivity from the tracers was measured. FIGURE 8.5 Detail of Alfred Hershey and Martha Chases 1952 publication describing their experiments with bacteriophage. Infected bacteria refers to the percentage of bacteria that survived the blender. The extracellular concentration of which isotope increased the most with blending?arrow_forwardHersheyChase Experiments The graph shown in FIGURE 8.5 is reproduced from an original 1952 publication by Hershey and Chase. Bacteriophage were labeled with radioactive tracers and allowed 10 infect bacteria. The virusbacteria mixtures were then whirled in a blender to dislodge any viral components attached to the exterior of the bacteria. Afterward, radioactivity from the tracers was measured. FIGURE 8.5 Detail of Alfred Hershey and Martha Chases 1952 publication describing their experiments with bacteriophage. Infected bacteria refers to the percentage of bacteria that survived the blender. How did the researchers know that the radioisotopes in the fluid came from outside of the bacterial cells and not from bacteria that had been broken apart by whirling in the blender?arrow_forwardHersheyChase Experiments The graph shown in FIGURE 8.5 is reproduced from an original 1952 publication by Hershey and Chase. Bacteriophage were labeled with radioactive tracers and allowed 10 infect bacteria. The virusbacteria mixtures were then whirled in a blender to dislodge any viral components attached to the exterior of the bacteria. Afterward, radioactivity from the tracers was measured. FIGURE 8.5 Detail of Alfred Hershey and Martha Chases 1952 publication describing their experiments with bacteriophage. Infected bacteria refers to the percentage of bacteria that survived the blender. Do these results imply that viruses inject DNA or protein into bacteria? Why or why not?arrow_forward
- HersheyChase Experiments The graph shown in FIGURE 8.5 is reproduced from an original 1952 publication by Hershey and Chase. Bacteriophage were labeled with radioactive tracers and allowed 10 infect bacteria. The virusbacteria mixtures were then whirled in a blender to dislodge any viral components attached to the exterior of the bacteria. Afterward, radioactivity from the tracers was measured. FIGURE 8.5 Detail of Alfred Hershey and Martha Chases 1952 publication describing their experiments with bacteriophage. Infected bacteria refers to the percentage of bacteria that survived the blender. After 4 minutes in the blender, what percentage of each isotope was extracellular?arrow_forwardA scientist isolates a new species of prokaryote He notes that the specimen is a bacillus with a lipid bilayer and cell wall that stains positive for peptidoglycan. Its circular chromosome replicates from a single origin of replication. Is the specimen most likely an Archaea, a Gram-positive bacterium, or a Gram-negative bacterium? How do you know?arrow_forwardHelping tags; biology, food, scientists What topic may have been developed to address food safety issues in the Philippines if the following pairings had the opportunity to collaborate? Choose one pair only. Louis Pasteur, Watson and Crick Anton Van Leeuwenhoek and Alexander Fleming Nicolas Appert and Julius Richard Petri Hans Christian Gram and Robert Koch Joseph Lister and Peter Durand ** WILL UPVOTE, just pls help me answer the question. Thankarrow_forward
- Experiment: DNA Extraction from Banana The procedures are attached below. Questions: 1. What does mashing do to the fruit? And why is it needed to add detergents?2. What do you think the ethanol does? Why can’t we use room temperature ethanol?arrow_forwardThe Bacteria Escherichia coli DNA genome has a molecular mass of about 3.1 X 10⁹ In your answers, show how you came up to each result? How long is this DNA in micrometer (μm)arrow_forwardMULTIPLE CHOICE Read the questions below carefully. There is only one correct answer for each question. 1. In a DNA sample of Escherichia coli (a bacteria), 23.6% of the nitrogenous bases are thymine. What percentage of cytosine nitrogen bases is present in this sample? a) 76.4% b) 23.6% c)26.4% d) 52.8% 2. If the adenine is located on the Z strand as shown (see attachement 3) , then on the W strand, in the same place, we should find: a) Uracil b) Adenine c) Thymine d)Cytosine 3. Which of these deletions best represents a chromosomal deletion? (see options in attachment 3) 4. It is known that RNA is a nucleic acid responsible for the synthesis of proteins. However, there is another nucleic acid alongside RNA: DNA. What role does the latter play in relation to RNA? a) RNA is synthesized in the cell in case too large a mutation damages the DNA. b) DNA has the reproductive genetic code of all cells and passes it on to RNA. c) DNA directs the synthesis of enzymes, while RNA synthesizes…arrow_forward
 Biology: The Unity and Diversity of Life (MindTap...BiologyISBN:9781337408332Author:Cecie Starr, Ralph Taggart, Christine Evers, Lisa StarrPublisher:Cengage Learning
 Biology: The Unity and Diversity of Life (MindTap...BiologyISBN:9781305073951Author:Cecie Starr, Ralph Taggart, Christine Evers, Lisa StarrPublisher:Cengage Learning
 Biology Today and Tomorrow without Physiology (Mi...BiologyISBN:9781305117396Author:Cecie Starr, Christine Evers, Lisa StarrPublisher:Cengage Learning
 Biology 2eBiologyISBN:9781947172517Author:Matthew Douglas, Jung Choi, Mary Ann ClarkPublisher:OpenStax
 Human Heredity: Principles and Issues (MindTap Co...BiologyISBN:9781305251052Author:Michael CummingsPublisher:Cengage Learning