
Videos
To sketch: The graph of the inequality
Explanation of Solution
In order to sketch the graph of the inequality
Obtain the values of y, when
| x | −2 | 0 | 4 |
| y | 10 | 5 | −5 |
Since the given inequality is “less than or equal to”, the points on the line are part of the solution.
Hence, use a solid line to join the points in the above table and obtain the graph of
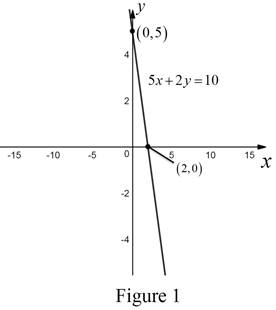
From Figure 1, it is observed that the graph of the straight line
Take any arbitrary point as a test point which is not on the line
The half plane which contains the test point which satisfies the inequality is the solution.
Let
Substitute the values
This is true.
Therefore, the left half plane of the line
Use the above mentioned information and sketch the graph of the inequality
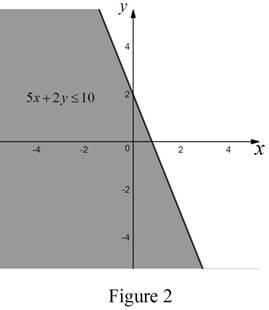
From Figure 2, it is observed that the shaded region and the line
Want to see more full solutions like this?
Chapter 8 Solutions
EBK COLLEGE ALGEBRA IN CONTEXT


 Holt Mcdougal Larson Pre-algebra: Student Edition...AlgebraISBN:9780547587776Author:HOLT MCDOUGALPublisher:HOLT MCDOUGAL
 Algebra & Trigonometry with Analytic GeometryAlgebraISBN:9781133382119Author:SwokowskiPublisher:Cengage
 Glencoe Algebra 1, Student Edition, 9780079039897...AlgebraISBN:9780079039897Author:CarterPublisher:McGraw Hill
 Algebra: Structure And Method, Book 1AlgebraISBN:9780395977224Author:Richard G. Brown, Mary P. Dolciani, Robert H. Sorgenfrey, William L. ColePublisher:McDougal Littell