
Videos
Gulf Real Estate Properties
Gulf Real Estate Properties, Inc., is a real estate firm located in southwest Florida. The company, which advertises itself as “expert in the real estate market,” monitors condominium sales by collecting data on location, list price, sale price, and number of days it takes to sell each unit. Each condominium is classified as Gulf View if it is located directly on the Gulf of Mexico or No Gulf View if it is located on the bay or a golf course, near but not on the Gulf. Sample data from the Multiple Listing Service in Naples, Florida, provided recent sales data for 40 Gulf view condominiums and 18 No Gulf view condominiums. Prices are in thousands of dollars. The data are shown in Table 8.7.
Managerial Report
- 1. Use appropriate
descriptive statistics to summarize each of the three variables for the 40 Gulf View condominiums. - 2. Use appropriate descriptive statistics to summarize each of the three variables for the 18 No Gulf View condominiums.
- 3. Compare your summary results. Discuss any specific statistical results that would help a real estate agent understand the condominium market.
- 4. Develop a 95% confidence
interval estimate of the populationmean sales price and population mean number of days to sell for Gulf View condominiums. Interpret your results. - 5. Develop a 95% confidence interval estimate of the population mean sales price and population mean number of days to sell for No Gulf View condominiums. Interpret your results.
- 6. Assume the branch manager requested estimates of the mean selling price of Gulf View condominiums with a margin of error of $40,000 and the mean selling price of No Gulf View condominiums with a margin of error of $15,000. Using 95% confidence, how large should the
sample sizes be? - 7. Gulf Real Estate Properties just signed contracts for two new listings: a Gulf View condominium with a list price of $589,000 and a No Gulf View condominium with a list price of $285,000. What is your estimate of the final selling price and number of days required to sell each of these units?
1.
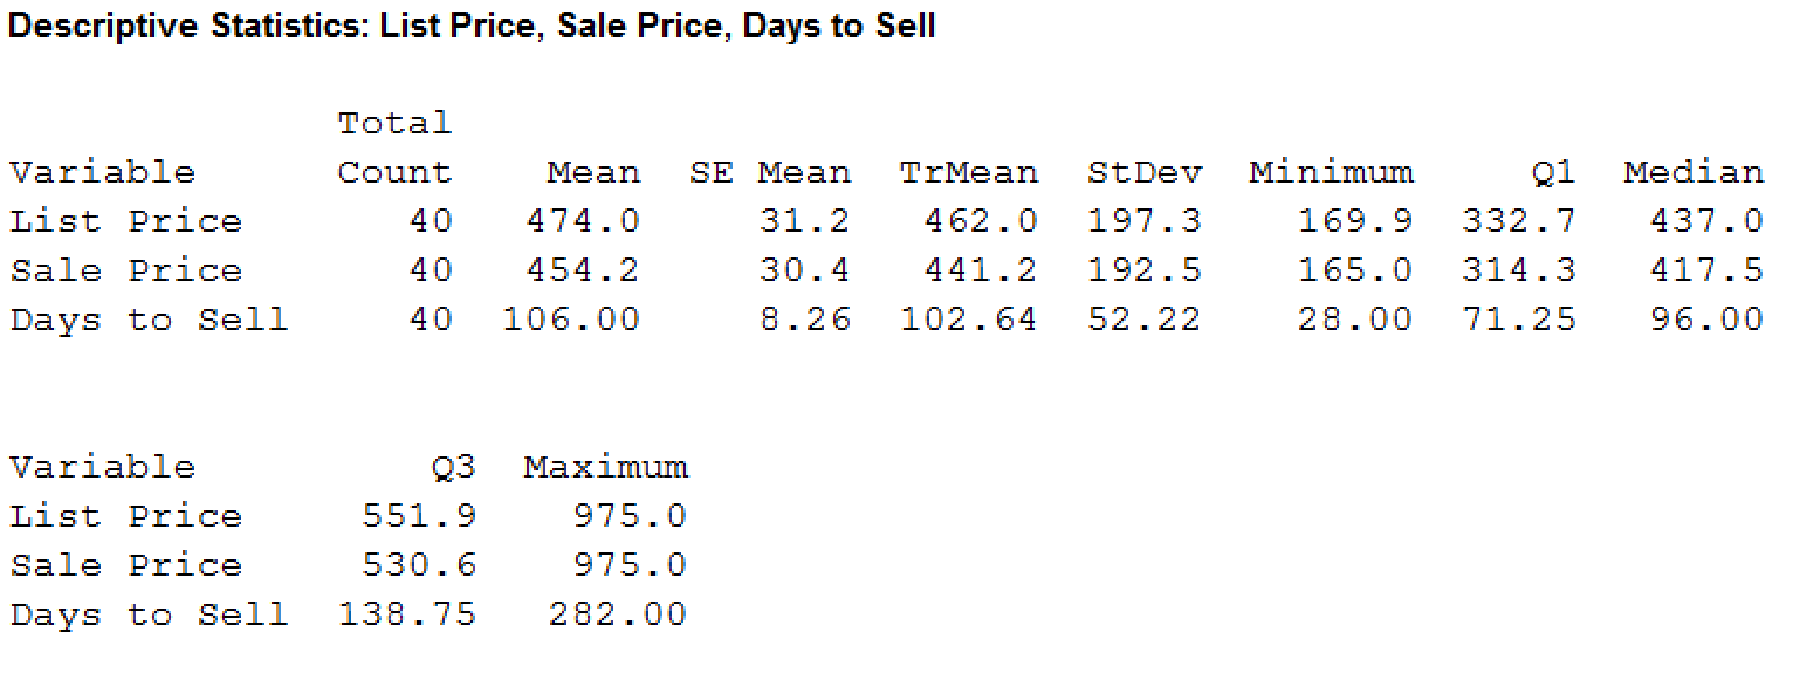
Find the appropriate descriptive statistics for Gulf View condominiums.
Answer to Problem 2CP
Output using the MINITAB software is given below:
Explanation of Solution
Calculation:
The given information is that the Gulf Real estate properties firm located in the Southwest Florida advertises itself as an “expert in the real estate market”. The data are collected on the sales on a particular location, list price, and the number of days it takes to sell each unit. The condominium is classified as gulf view and no gulf view.
Software Procedure:
Step by step procedure to obtain the descriptive statistics using the MINITAB software:
- Choose Stat > Basic Statistics > Display Descriptive Statistics.
- In Variables enter the columns List Price, Sale Price, and Days to Sell.
- In Statistics select Mean, Median, Trimmed Mean, Standard Deviation, Standard Error Mean, Minimum, Maximum, Quartile 1, Quartile 3, and Total.
- Click OK.
2.
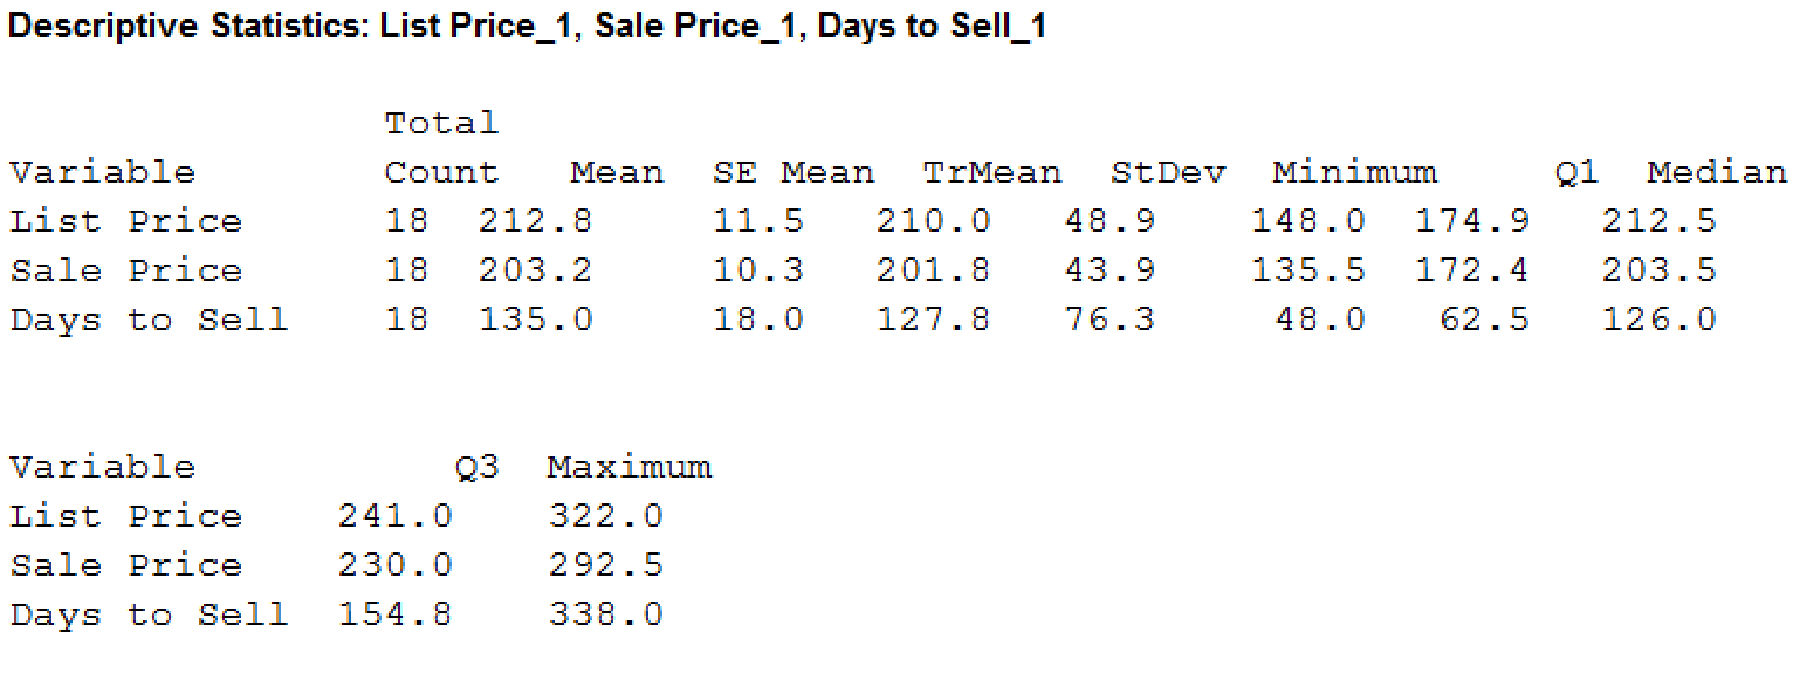
Find the appropriate descriptive statistics for No Gulf View condominiums.
Answer to Problem 2CP
Output using the MINITAB software is given below:
Explanation of Solution
Calculation:
Calculate the appropriate descriptive statistics for No Gulf View condominiums:
Software Procedure:
Step by step procedure to obtain the descriptive statistics using the MINITAB software:
- Choose Stat > Basic Statistics > Display Descriptive Statistics.
- In Variables enter the columns List Price, Sale Price, and Days to Sell.
- In Statistics select Mean, Median, Trimmed Mean, Standard Deviation, Standard Error Mean, Minimum, Maximum, Quartile 1, Quartile 3, and Total.
- Click OK.
3.
Compare the results and explain any particular statistic that results to help the real estate agent to know the condominium market.
Explanation of Solution
Observation:
The mean price for the Gulf View condominium list is $474,000 and the median price is $437,000. The mean price for the No Gulf View condominium list is $21,800 and the median price is $212,500. It reflects that the Gulf View condominiums are most expensive and they are two times of the No Gulf Views.
The mean number of days to sell a condominium of Gulf view is slightly better than the No Gulf view condominium. It indicates that nearly three months will be taken to sell a Gulf View condominium and nearly four months will be taken to sell a No Gulf View condominium.
The most expensive list-price is for a Gulf view condominium and the least expensive list-price is for No Gulf view condominium.
The Gulf view condominiums with mean list price are $474,000 and a mean sale price is $454,200. It is sold on an average of $19,800 and it is 4.2% below list price.
The No Gulf view condominiums with mean list price are $212,800 and a mean sale price is $203,200. It is sold on an average of $9,600 and it is 4.5% below list price.
Gulf view condominiums are more expensive and tend to sell slightly faster than the No Gulf view.
4.
Find the 95% confidence interval for the population mean sales price and the population mean number of days to sell for Gulf view condominiums.
Interpret the results.
Answer to Problem 2CP
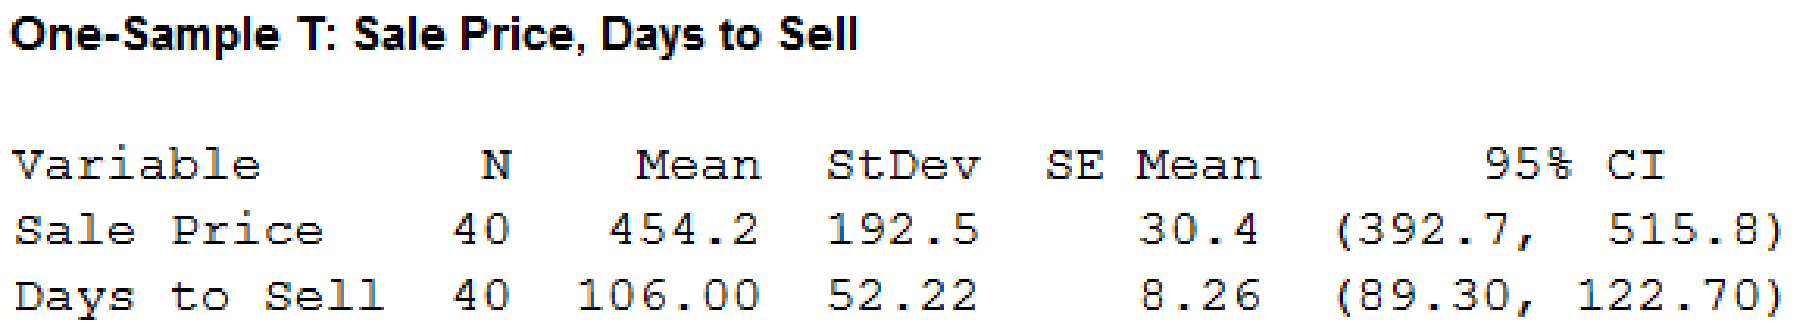
The 95% confidence interval for the population mean sales price for Gulf view condominiums is ($392,700, $515,800) and the population mean number of days to sell for Gulf view condominiums is (89 days, 123 days).
Explanation of Solution
Calculation:
Calculate the 95% confidence interval for the population mean sales price and the population mean number of days to sell for Gulf view condominiums.
Software Procedure:
Step-by-step procedure to obtain the confidence interval using the MINITAB software:
- Choose Stat > Basic Statistics > 1-Sample T.
- In Samples in columns, enter the variable sales price, days to sell.
- Check Options; enter Confidence level as 95%.
- Click OK.
Output using the MINITAB software is given below:
Observation:
The sales price of the Gulf View condominiums is from $392,700 to $515,800 and the days to sell Gulf View condominiums are 89 days to 123 days.
5.
Find the 95% confidence interval for the population mean sales price and the population mean number of days to sell for No Gulf view condominiums.
Interpret the results.
Answer to Problem 2CP
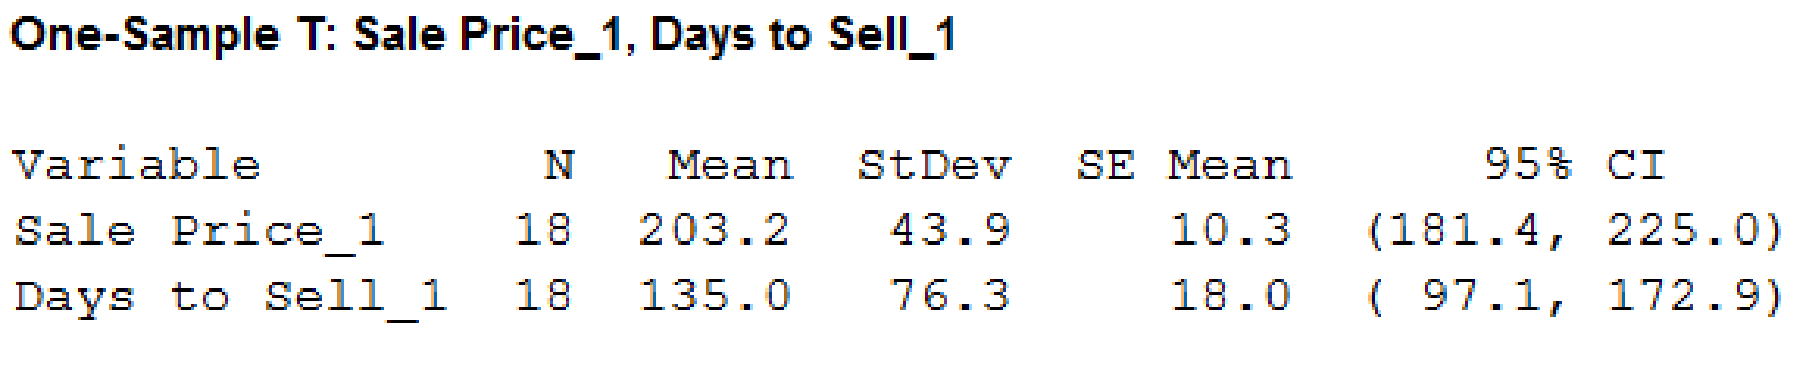
The 95% confidence interval for the population mean sales price for No Gulf view condominiums is ($181,400, $225,000) and the population mean number of days to sell for No Gulf view condominiums is (97 days, 173 days).
Explanation of Solution
Calculation:
Calculate the 95% confidence interval for the population mean sales price and the population mean number of days to sell for No Gulf view condominiums.
Software Procedure:
Step-by-step procedure to obtain the confidence interval using the MINITAB software:
- Choose Stat > Basic Statistics > 1-Sample T.
- In Samples in columns, enter the variable sales price, days to sell.
- Check Options; enter Confidence level as 95%.
- Click OK.
Output using the MINITAB software is given below:
Observation:
The sales price of the No Gulf View condominiums is from $181,400 to $225,000 and the days to sell No Gulf View condominiums are 97 days to 173 days.
6.
Find the sample size for the Gulf view and No Gulf view condominiums for estimating the mean selling price.
Answer to Problem 2CP
The sample size for the Gulf view for estimating the mean selling price is 89 and the sample size for the No Gulf view for estimating the mean selling price is 23.
Explanation of Solution
Calculation:
The sample size for the interval estimate of a population mean is as follows:
From “Table 8.1 value of
For Gulf view condominiums:
From Part (1), the standard deviation for Gulf view selling price is 192.5.
The sample size is as follows:
Thus, the sample size of 89 is required.
For No Gulf view condominiums:
From Part (2), the standard deviation for No Gulf view selling price is 43.9.
The sample size is as follows:
Thus, the sample size of 23 is required.
7.
Find the final selling price and the number of days required to sell each of the unit.
Answer to Problem 2CP
The final selling price and the number of days required to sell each of the unit are $564,262 and 106 days, respectively, for Gulf view condominium.
The final selling price and the number of days required to sell each of the unit are $272,175 and 135 days, respectively, for No Gulf view condominium.
Explanation of Solution
Calculation:
Here, a Gulf view condominium with a list price is $589,000 and a No Gulf view condominium with a list price is $285,000.
From Part (3), the Gulf view condominium is sold on an average of 4.2% below its list price.
The estimated selling price is as follows:
The estimated number of days to sell each of the unit is 106 days.
From Part (3), the No Gulf view condominium is sold on an average of 4.5% below its list price.
The estimated selling price is as follows:
The estimated number of days to sell each of the unit is 135 days.
Want to see more full solutions like this?
Chapter 8 Solutions
Modern Business Statistics with Microsoft Office Excel (with XLSTAT Education Edition Printed Access Card)


- An business reviews data on the daily amount of calls it receives. Are the data discrete or continous?arrow_forwardBicycling World, a magazine devoted to cycling, reviews hundreds of bicycles throughout the year. Its "Road-Race" category contains reviews of bicycles used by riders primarily interested in racing. One of the most important factors in selecting a bicycle for racing is the weight of the bicycle. The following data show the weight (pounds) and price ($) for ten racing bicycles reviewed by the magazine. Model Weight Price Fierro 7B 17.9 2200 HX 5000 16.2 6350 Durbin Ultralight 16 8490 Schmidt 16.2 6300 WSilton Advanced 17.5 4100 bicyclette vélo 15.2 8500 Supremo Team 16.5 6200 XTC Racer 17.6 2680 D’Onofrio Pro 17.5 4500 Americana #6 13.6 8200 Use the data to develop an estimated regression equation that could be used to estimate the price for a bicycle given its weight. What is the estimated regression model? Group of answer choices y = -1512x + 30578 y = 1351x + 26327 y = -1161x + 24489 y = -1457x + 27903 y = 1341x + 25176arrow_forwardUnited Dairies, Inc., supplies milk to several independent grocers throughout Dade County, Florida. Managers at United Dairies want to develop a forecast of the number of half-gallons of milk sold per week. Sales data for the past 12 weeks follow and have been transferred in the data file UDFMilk.xlsx download(also posted under week 11 module). Week Sales Week Sales 1 2750 7 3300 2 3100 8 3100 3 3250 9 2950 4 2800 10 3000 5 2900 11 3200 6 3050 12 3150 By Thursday, April 15 (11:55pm PST), answer the following 2 questions and attach a word doc or excel file to show your work. Use the data in the file UDFMilk.xlsx downloadto construct a time series plot. What type of pattern exists in the data? Use exponential smoothing with to develop a forecast of demand for week 13.arrow_forward
- please. help me answer this question. thank youarrow_forwardThe average monthly residential gas bill for Black Hills Energy customers in Cheyenne, Wyoming is (Wyoming Public Service Commission website). How is the average monthly gas bill for a Cheyenne residence related to the square footage, number of rooms, and age of the residence? The following data show the average monthly gas bill for last year, square footage, number of rooms, and age for typical Cheyenne residences. Average Monthly Gas Number of Bill for Last Year Age Square Footage Rooms $70.20 16 2537 6 $81.33 2 3437 8 $45.86 27 976 6 $59.21 11 1713 7 $117.88 16 3979 11 $57.78 2 1328 7 $47.01 27 1251 6 $52.89 4 827 5 $32.90 12 645 4 $67.04 29 2849 5 $76.76 1 2392 7 $60.40 26 900 5 $44.07 14 1386 5 $26.68 20 1299 4 $62.70 17 1441 6 $45.37 13 562 4 $38.09 10 2140 4 $45.31 22 908 6 $52.45 24 1568 5 $96.11 27 1140 10…arrow_forwardThe success of an airline depends heavily on its ability to provide a pleasant customer experience. One dimension of customer service on which airines compete is on-time arrival. The file LateFlights contains a sample of data from delayed fights showing the number of minutes each delayed fight was late for two different airlines, Deita and Southwest. Click on the datafile logo to reference the data. DATA file Delta Southwest Delta Southwest Delta Southwest Delta Southwest Delta 36 30 34 38 119 120 63 37 35 67 114 53 102 55 8 87 68 100 43 50 86 74 17 66 87 35 40 34 64 41 53 30 86 33 57 61 7. 46 52 26 70 62 75 54 80 a. Formulate the hypotheses that can be used to test for a difference between the population mean minutes late for delayed flights by these two airlines. H1= population mean minutes late for delayed Deita flights Ha= population mean minutes late for delayed Southwest flights Ho: H- 2 Select your answer H.: -a -Select your answer b. What is the sample mean number of minutes…arrow_forward
- Johnson Filtration, Inc. provides maintenance service for water-filtration systems. Suppose that in addition to information on the number of months since the machine was serviced and whether a mechanical or an electrical repair was necessary, the managers obtained a list showing which repairperson performed the service. The revised data follow. Click on the datafile logo to reference the data. DATA file Repair Time Months Since in Hours Last Service Type of Repair Repairperson 2.9 Electrical Dave Newton 3.0 Mechanical Dave Newton 4.8 8. Electrical Bob Jones 1.8 Mechanical Dave Newton 2.9 Electrical Dave Newton 4.9 Electrical Bob Jones 4.2 6. Mechanical Bob Jones 4.8 8. Mechanical Bob Jones 4.4 4. Electrical Bob Jones 4.5 Electrical Dave Newton a. Ignore for now the months since the last maintenance service (1 ) and the repairperson who performed the service. Develop the estimated simpe linear regression equation to predict the repair time (y) given the type of repair (2 ). Recall that…arrow_forwardCollege students and surfers Rex Robinson and Sandy Hudson collected data on the self-reported number of days surfed in a month for 30 longboard surfers and 30 shortboard surfers. Complete parts a and b below. Longboard: 9,6,4,10,21,16,9,22,11,4,21,7,16,7,16,18,16,6,5,21,6,14,16,22,15,5,15,7,14,20 compute the means for both longboards and shortboards. The Mean for longboards is? my answer is 6.0713194233404 and it says round to one decimal places as needed I put 6.1 it was wrong should my answer be 6.0arrow_forwardGoogle has changed its strategy with regard to how much and over which media it invests in advertising. The following table shows Google's marketing budget in millions of dollars for 2008 and 2011 (The Wall Street Journal, March 27, 2012). 2008 2011 Internet $26.0 $123.3 Newspaper, etc. $4.0 $20.7 Television $0.0 $69.3 a. Select a side-by-side bar chart with year as the variable on the horizontal axis.arrow_forward
- A real estate agent wanted to find the relationship between sale price of houses and the size of the house. She collected data on two variables recorded in the following table for 15 houses in Seattle. The two variables are PRICE= Sale price of houses in thousands of dollars SIZE= Area of the entire house in square feet. PRICE 455 278 463 327 505 264 445 346 487 289 434 411 223 323 488 250 225 290 180 320 240 270 205 285 240 260 230 170 230 298 SIZE a) Using MICROSOFT EXCEL- run the above regression and copy the output into your assignment word document from which you can write down the least square regression line. Write down the least square regression line from that specific output. USE THE NAME OF VARIABLES WHEN YOU WRITE THE EQUATION. b) Interpret the slope and constant term with proper UNITS assigned. c) Comment on the explanatory power of the regression model from the required output. Copy that specific output into your assignment word document. Now to increase the explanatory…arrow_forwardOn December 17, 2007 baseball writer John Hickey wrote an article for the Seattle P-I about increases to ticket prices for Seattle Mariners games during the 2008 season. The article included a data set that listed the average ticket price for each MLB team, the league in which the team plays (AL or NL), the number of wins during the 2007 season and the cost per win (in dollars). The data for the 16 National League teams are shown below. team league price wins cost/win Arizona Diamondbacks NL 19.68 90 35.40 Atlanta Braves NL 17.07 84 32.89 Chicago Cubs NL 34.30 85 65.33 Cincinnati Reds NL 17.90 72 40.32 Colorado Rockies NL 14.72 90 26.67 Florida Marlins NL 16.70 71 38.13 Houston Astros NL 26.66 73 59.11 Los Angeles Dodgers NL 20.09 82 34.64 Milwaukee Brewers NL 18.11 83 35.37 N.Y. Mets NL 25.28 88 46.56 Philadelphia Phillies NL 26.73 89 48.69 Pittsburgh Pirates NL 17.08 68 40.67 San Diego Padres NL 20.83 89 38.15 San Francisco Giants NL 24.53 71…arrow_forwardThe higher education department of Holmes Institute recorded data on the number of students enrolled in the different study majors for the years 2018 and 2019. Study major 2018 2019 Statistics 1700 2250 Business law 700 900 Accounting 1300 1450 Economics 750 1000 Finance 1450 1758 Marketing management 1069 1189 Auditing 360 351 Use an appropriate graphical technique or chart to compare the number of enrolment in 2018 and 2019 of the different study major. Display the chart. Use an appropriate graphical technique or chart to display the percentage value of the number of enrolment of the different study major in 2018 and 2019. Display the chart.arrow_forward
 Glencoe Algebra 1, Student Edition, 9780079039897...AlgebraISBN:9780079039897Author:CarterPublisher:McGraw Hill
 Holt Mcdougal Larson Pre-algebra: Student Edition...AlgebraISBN:9780547587776Author:HOLT MCDOUGALPublisher:HOLT MCDOUGAL
 Big Ideas Math A Bridge To Success Algebra 1: Stu...AlgebraISBN:9781680331141Author:HOUGHTON MIFFLIN HARCOURTPublisher:Houghton Mifflin Harcourt
 Functions and Change: A Modeling Approach to Coll...AlgebraISBN:9781337111348Author:Bruce Crauder, Benny Evans, Alan NoellPublisher:Cengage Learning