
Gen Combo Looseleaf Principles Of Corporate Finance With Connect Access Card
13th Edition
ISBN: 9781260695991
Author: Richard A Brealey
Publisher: McGraw-Hill Education
expand_more
expand_more
format_list_bulleted
Concept explainers
Videos
Textbook Question
Chapter 8, Problem 2PS
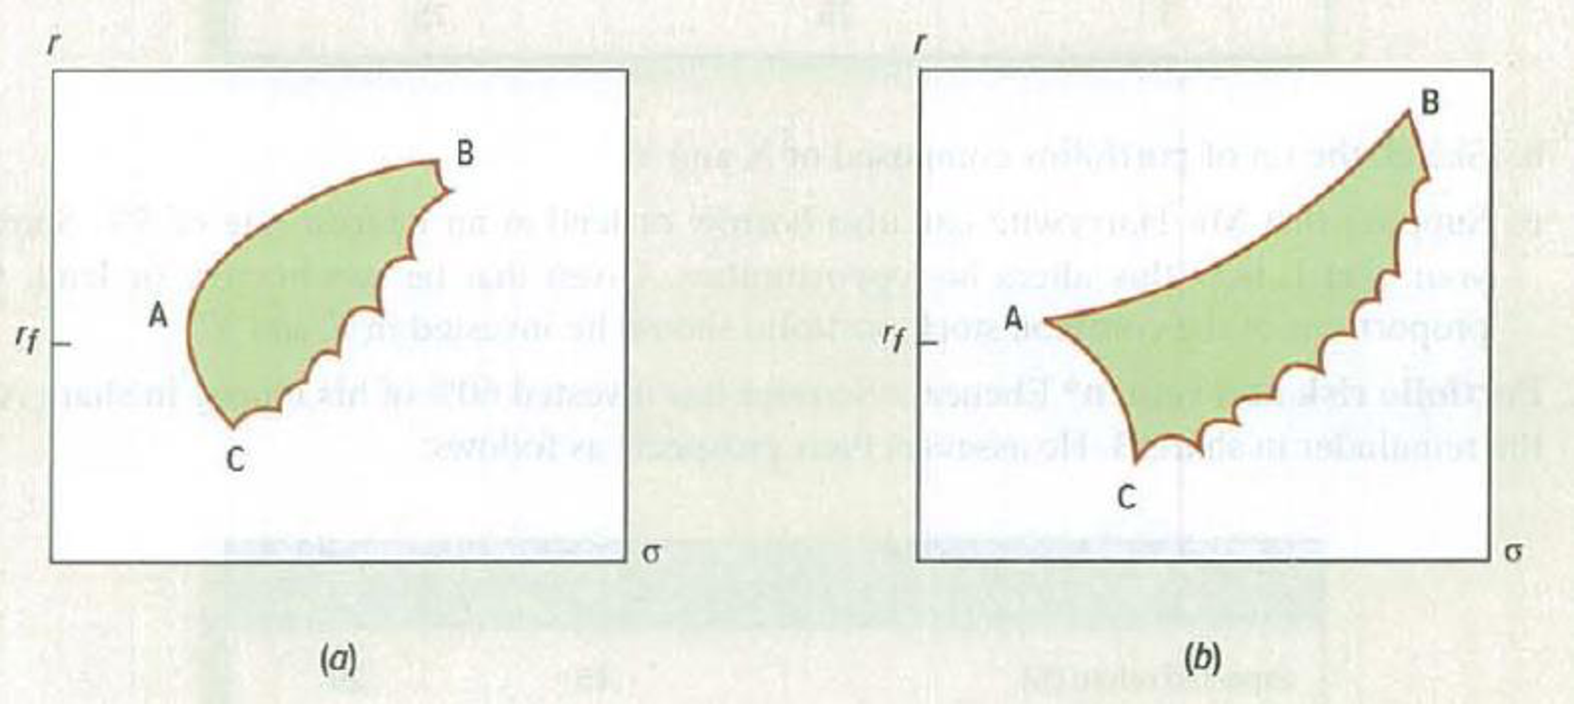
Efficient portfolios Figure 8.11 purports to show the range of attainable combinations of expected return and standard deviation.
a. Which diagram is incorrectly drawn and why?
b. Which is the efficient set of portfolios?
c. If rf is the rate of interest, mark with an X the optimal stock portfolio.
Expert Solution & Answer
Want to see the full answer?
Check out a sample textbook solution
Students have asked these similar questions
Consider the following performance data for a portfolio manager:
Benchmark
Portfolio
Index
Portfolio
Weight
Weight
Return
Return
Stocks
0.65
0.7
0.11
0.12
Bonds
0.3
0.25
0.07
0.08
Cash
0.05
0.05
0.03
0.025
a.Calculate the percentage return that can be attributed to the asset allocation decision.
b.Calculate the percentage return that can be attributed to the security selection decision.
Which of the following statements regarding the graph of the
SML is most accurate?
Select one
O A.
O B.
B-1.0
The beta of Portfolios A, B, and C are identical as they fall directly
on the line.
The expected return of Portfolio C is the difference between the
market's expected return and the risk-free rate.
O C. Portfolio A has lower systematic risk than Portfolio B.
OD. The slope of the line is the market risk premium.
The optimal proportion of the risky asset in the complete portfolio is
given by the equation below
y*=
E(Rp− Rf)
A0²
For each of the variables on the right side of the equation, discuss the
impact of the variable's effect on y* and why the nature of the relationship
makes sense intuitively.
Assume the investor is risk averse
Chapter 8 Solutions
Gen Combo Looseleaf Principles Of Corporate Finance With Connect Access Card
Ch. 8 - Efficient portfolios For each of the following...Ch. 8 - Efficient portfolios Figure 8.11 purports to show...Ch. 8 - Portfolio risk and return Look back at the...Ch. 8 - Portfolio risk and return Mark Harrywitz proposes...Ch. 8 - Portfolio risk and return Ebenezer Scrooge has...Ch. 8 - Portfolio risk and return Here are returns and...Ch. 8 - Portfolio risk and return Percival Hygiene has IO...Ch. 8 - Sharpe ratio Use the long-term data on security...Ch. 8 - Portfolio beta Refer to Table 7.5. a. What is the...Ch. 8 - CAPM True or false? Explain or qualify as...
Ch. 8 - CAPM True or false? a. The CAPM implies that if...Ch. 8 - CAPM Suppose that the Treasury bill rate is 6%...Ch. 8 - CAPM The Treasury bill rate is 4%, and the...Ch. 8 - Cost of capital Epsilon Corp. is evaluating an...Ch. 8 - APT Consider a three-factor APT model. The factors...Ch. 8 - Prob. 18PSCh. 8 - APT Consider the following simplified APT model:...Ch. 8 - Prob. 20PSCh. 8 - Three-factor modelThe following table shows the...Ch. 8 - Efficient portfolios Look again at the set of the...
Knowledge Booster


Learn more about
Need a deep-dive on the concept behind this application? Look no further. Learn more about this topic, finance and related others by exploring similar questions and additional content below.Similar questions
- choose which one ? 3.Assume CAPM holds. What is the correlation between an efficient portfolio and the market portfolio?a.1b.-1c.0d.Not enough informationarrow_forwardWrite out the equation for the Capital Market Line (CML), and draw it on the graph. Interpret the plotted CML. Now add a set of indifference curves and illustrate how an investors optimal portfolio is some combination of the risky portfolio and the risk-free asset. What is the composition of the risky portfolio?arrow_forwardYou are given the following information concerning three portfolios, the market portfolio, and the risk-free asset: Portfolio X Y Z Market Risk-free Rp 11.0% ор 33.00% 10.0 28.00 8.1 10.4 5.2 18.00 23.00 Ө вр 1.45 1.20 0.75 1.00 Ө Assume that the correlation of returns on Portfolio Y to returns on the market is 0.66. What percentage of Portfolio Y's return is driven by the market? Note: Enter your answer as a decimal not a percentage. Round your answer to 4 decimal places. R-squaredarrow_forward
- The following figures show the optimal portfolio choice for two investors with different levels of risk-aversion graphically. Which statement is correct? E[R] 0.3 0.25 0.2 0.15 0.1 0.05 0 0 0.05 0.1 0.15 Figure 1 0.2 0.25 0.3 0.35 o(R) 0.4 0.45 [H]Z 0.3 0.25 0.2 0.15 0.1 0.05 0 0 0.05 0.1 Figure (2) shows an investor that borrows in risk-free rate and invests in the risky asset. Figure (1) shows an investor with a conservative investment behavior. In the optimal point of both figures, the highest indifference curve is tangent to the efficient frontier. In Figure (1), more aggressive investment decision led to a higher Sharpe ratio. 0.15 Figure 2 0.2 0.25 o (R) 0.3 0.35 0.4 0.45arrow_forwardYou are given the following information concerning three portfolios, the market portfolio, and the risk-free asset: 8p 1.70 1.30 0.85 1.00 Portfolio X Y Z Market Risk-free Rp 11.5% 10.5 7.2 10.9 4.6 R-squared op 38.00% 33.00 23.00 28.00 0 Assume that the correlation of returns on Portfolio Y to returns on the market is 0.76. What percentage of Portfolio Y's return is driven by the market? Note: Enter your answer as a decimal not a percentage. Round your answer to 4 decimal places.arrow_forwardWhat is the correlation coefficient between returns on any efficient portfolio and returns on the market portfolio in CAPM? 0.5 -0.5 -1 1 Oarrow_forward
- An efficient portfolio is one that: Select one: a. maximises return for a given level of risk. b. maximises risk for a given level of return. c. minimises risk for a given rate of return. d. Both A and C. are efficient portfolios.arrow_forwardYou are given the following information concerning three portfolios, the market portfolio, and the risk-free asset: Portfolio X Y Z Market Risk-free Rp 14.0% 13.0 .8.5 12.0 7.2 Ор 39.00% 34.00 24.00 29.00 0 Bp 1.50 1.15 0.90 1.00 0 Assume that the correlation of returns on Portfolio Y to returns on the market is 0.90. What percentage of Portfolio Y's return is driven by the market? Note: Enter your answer as a decimal not a percentage. Round your answer to 4 decimal places. R-squaredarrow_forwardUse the following table to answer the questions a-c below. Standard deviation of risky | return Risky Expected return on risky portfolio Risk-free Sharpe-ratio Portfolio portfolio 1 12 3.5 4.5 2 13 3.75 4.5 3 14 4 4.5 4 15 4.25 4.5 a. Calculate the Sharpe ratio for each portfolio b. Identify the optimal portfolio from the above 4arrow_forward
- Which of the following statements regarding the graph of the SML is most accurate? A Select one OA. The beta of Portfolios A, B, and C are identical as they fall directly on the line. B. The expected return of Portfolio C is the difference between the market's expected return and the risk-free rate. C. Portfolio A has lower systematic risk than Portfolio B. D. The slope of the line is the market risk premium.arrow_forwardThe concept of Portfolio Effect indicates that the more assets added to the portfolio, the less risk of the total portfolio Select one: O True O False Ne Jump to... CHAPTER 5-STOCK VALUAarrow_forwardAs diversification increases, the firm-specific risk of a portfolio approaches A. 1. B. infinity. C. 0. D. (n – 1) × n.arrow_forward
arrow_back_ios
SEE MORE QUESTIONS
arrow_forward_ios
Recommended textbooks for you
 EBK CONTEMPORARY FINANCIAL MANAGEMENTFinanceISBN:9781337514835Author:MOYERPublisher:CENGAGE LEARNING - CONSIGNMENT
 Intermediate Financial Management (MindTap Course...FinanceISBN:9781337395083Author:Eugene F. Brigham, Phillip R. DavesPublisher:Cengage Learning
EBK CONTEMPORARY FINANCIAL MANAGEMENT
Finance
ISBN:9781337514835
Author:MOYER
Publisher:CENGAGE LEARNING - CONSIGNMENT
Intermediate Financial Management (MindTap Course...
Finance
ISBN:9781337395083
Author:Eugene F. Brigham, Phillip R. Daves
Publisher:Cengage Learning
Portfolio Management; Author: DevTechFinance;https://www.youtube.com/watch?v=Qmw15cG2Mv4;License: Standard YouTube License, CC-BY