
Videos
Your comparison of the gross margin percent for Jones Drugs for the years 2013 through 2016 indicates a significant decline. This is shown by the following information:
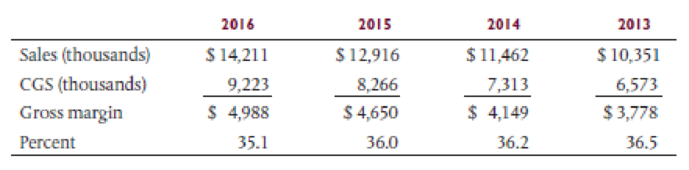
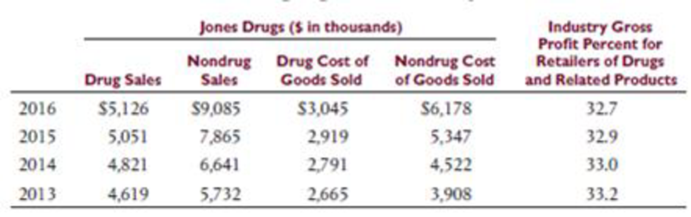
A discussion with Marilyn Adams, the controller, brings to light two possible explanations. She informs you that the industry gross profit percent in the retail drug industry declined fairly steadily for three years, which accounts for part of the decline. A second factor was the declining percent of the total volume resulting from the pharmacy part of the business. The pharmacy sales represent the most profitable portion of the business, yet the competition from discount drugstores prevents it from expanding as fast as the nondrug items such as magazines, candy, and many other items sold. Adams feels strongly that these two factors are the cause of the decline.
The following additional information is obtained from independent sources and the client's records as a means of investigating the controller's explanations:
Required
- a. Evaluate the explanation provided by Adams. Show calculations to support your conclusions.
- b. Which specific aspects of the client's financial statements require intensive investigation in this audit?
Want to see the full answer?
Check out a sample textbook solution
Chapter 8 Solutions
EP AUDITING+ASSURANCE...-MYACCT.LAB


- Happy Valley Homecare Suppliers, Incorporated (HVHS), had $13.6 million in sales in 2010. Its cost of goods sold was $5.44 million, and its average inventory balance was $1.67 million. a. Calculate the average number of days inventory outstanding ratios for HVHS. b. The average number of inventory days in the industry is 73 days. By how muchmust HVHS reduce its investment in inventory to improve its inventory days to meet the industry? (Hint: Use a 365-day year.)arrow_forwardA condensed income statement for Corolla Corporation and a partially completed vertical analysis are presented below. Required: 1. Complete the vertical analysis by computing each missing line item as a percentage of sales revenues. 2. Does Corolla's Cost of Goods sold for the current year, as a percentage of revenues, represent better or worse performance as compared to that for the previous year? 3. Has Corolla"s net profit margin increased, or decreased, over the two years? Complete this question by entering your answers in the tabs below. Required 1 Required 2 Required 3 Complete the vertical analysis by computing each missing line item as a percentage of sales revenues. (Round your answers to the nearest whole percent.) COROLLA CORPORATION Income Statement (summarized) (in millions of U.S. dollars) Current Year Previous Year Sales Revenues $ 2,085 100 % $ 2,155 100 % Cost of Goods Sold 1,727 83 % 1,631 % Selling, General, and Administrative Expenses 243 % 310 14 % Other Operating…arrow_forwardHappy Valley Homecare Suppliers, Incorporated (HVHS), had $11.7 million in sales in 2015. Its cost of goods sold was $4.68 million, and its average inventory balance was $1.84 million. a. Calculate the average number of days inventory outstanding ratios for HVHS. b. The average number of inventory days in the industry is 73 days. By how much must HVHS reduce its investment in inventory to improve its inventory days to meet the industry? (Hint: Use a 365-day year.) a. Calculate the number of days inventory outstanding ratios for HVHS. The number of inventory days outstanding is days. (Round to two demical places.) b. The average number of inventory days in the industry is 73 days. By how much must HVHS reduce its investment in inventory to improve its inventory days to meet the industry? To match the industry average number of inventory days, HVHS would reduce its inventory by $ million. (Round to three decimal place.)arrow_forward
- From last year to this year, Berry Barn reported that itsNet Sales increased from $300,000 to $400,000 and itsGross Profit increased from $90,000 to $130,000. Was theGross Profit increase caused by ( a ) an increase in salesvolume only, ( b ) an increase in gross profit per sale only,or ( c ) a combination of both? Explain your answer.arrow_forwardFortune Brands Home & Security, Inc., sells Master Lock padlocks. It reported an increase innet sales from $3.3 billion in 2011 to $3.6 billion in 2012, and an increase in gross profit from $1.0billion in 2011 to $1.2 billion in 2012. Based on these numbers, determine whether the change ingross profit was caused by an increase in gross profit per sale, an increase in sales volume, or acombination of the two.arrow_forwardThe following information is available to you for the Wooden Company: 2011 2010 Net Income. 53,394 39,510 Net Sales 233,715 182,795 From the information provided, calculate Wooden’s profit margin ratio for each year. Be sure to show your calculations. 2011 2010 Comment on the results, assuming that the industry average for the profit margin ratio is 25% for each of the two years.arrow_forward
- IBM reports that, for the years 2009 and 2008, the gross profit margins are 45.72% and 44.06% respectively. Both the net profit and the gross profit margins indicated stronger financial positions for IBM from 2008 until 2010. Which one of the following equations would IBM have used to calculate the gross profit margins? Select one: a. Gross profit/Sales x 100/1 b. Net income/Sales x 100/1 c. Gross profit/Net income x 100/1 d. Sales/Gross profit x 100/1arrow_forwardOver the past year, M.D. Ryngaert & Co. has realized an increase in its current ration and a drop in its total assets turnover ratio. However, the company’s sales, quick ration, and fixed assets turnover ratio have remained constant. What explains these changes?arrow_forwardRatio analysis of a company’s performance as shown in its profit and loss account may show a decline in profit margin (gross profit as a percentage of sales revenue) compared with the previous period. Required: Give five possible reasons for a decline in gross profit as a percentage of sales revenue from one year to the next, briefly explaining for each why it has the effect of reducing the percentage. Note: You are not required to consider factors, which reduce gross profit itself, only those that reduce the gross profit percentage of sales.arrow_forward
- You are trying to prepare financial statements for Bartlett Pickle Company, but seem to be missing its balance sheet. You have Bartlett's income statement, which shows sales last year were $300 million with a gross profit margin of 30 percent. You also know that credit sales equaled three-quarters of Bartlett's total revenues last year. In adlon, Bartlett had a collection period of 40 days, a payables period of 30 days, and an inventory turnover of 7 times based on cost of oods sold. Calculate Bartlett's year-ending balance for accounts receivable, inventory, and accounts payable. Note: Round your answers to 1 decimal place. Bartlett's year-ending balance (million) Accounts receivable Inventory Accounts payable BV3arrow_forward1. In FS analysis what is the basic objective of observing trends in data and ratios? 2. Distinguish between trend percentages and component percentages. Which would be better suited for analyzing the change in sales over a term of several years? 3. Net Sales of Premiere Gen. Store have been increasing at a reasonable rate but net income has been declining steadily as percentage of these sales? What appears to be the problem? 4. Under what circumstances would you consider a corporate net income P1million as being unreasonably LOW? HIGH? 1. What is the basic purpose for examining trends in a company's financial ratios and other data? 2. Why does an analyst compute financial ratios rather than simply studying raw financial data? 3. What is meant by financial leverage? 4. A company seeking a line of credit at a bank was turned down. The bank stated that the company's current ratio of 2:1 is not adequate. Can you give reasons why a 2:1 current ratio might not be adequate? 5. Why at…arrow_forwardAccording to the producer price index database maintained by the Bureau of Labor Statistics, the average cost of computer equipment fell 3.8 percent between January and December 2016. Let’s see whether these changes are reflected in the income statement of Computer Tycoon Inc. for the year ended December 31, 2016. 2016 2015 Sales Revenue $ 120,000 $ 150,000 Cost of Goods Sold 70,000 79,500 Gross Profit 50,000 70,500 Selling, General, and Administrative Expenses 38,000 41,000 Interest Expense 700 575 Income before Income Tax Expense 11,300 28,925 Income Tax Expense 2,500 7,000 Net Income $ 8,800 $ 21,925 Required: Compute the gross profit percentage for each year. Assuming that the change from 2015 to 2016 is the beginning of a sustained trend, is Computer Tycoon likely to earn more or less gross profit from each dollar of sales in 2017? Compute the net profit margin…arrow_forward

 AccountingAccountingISBN:9781337272094Author:WARREN, Carl S., Reeve, James M., Duchac, Jonathan E.Publisher:Cengage Learning,
 Accounting Information SystemsAccountingISBN:9781337619202Author:Hall, James A.Publisher:Cengage Learning,
 Horngren's Cost Accounting: A Managerial Emphasis...AccountingISBN:9780134475585Author:Srikant M. Datar, Madhav V. RajanPublisher:PEARSON
 Intermediate AccountingAccountingISBN:9781259722660Author:J. David Spiceland, Mark W. Nelson, Wayne M ThomasPublisher:McGraw-Hill Education
 Financial and Managerial AccountingAccountingISBN:9781259726705Author:John J Wild, Ken W. Shaw, Barbara Chiappetta Fundamental Accounting PrinciplesPublisher:McGraw-Hill Education